If you want to start investing in short-term rentals, there’s one thing you’re definitely going to need in your investment journey – Airbnb data by city.
Are you looking for ways how to invest in real estate? The short-term rental business continues to thrive, and investors are smiling all the way to the bank. More and more real estate investors are trying to get in, hoping to share in the lucrative returns.
As such, you can’t just put your hard-earned money blindly into the investment. You’ll need access to reliable Airbnb data by city. It is the best way to determine whether this investment will be great for you or not and how much return on investment you can expect.
In today’s post, we look at what reliable Airbnb data by city is, some of the crucial reasons why you need it, and where you can access such essential information.
What Is Airbnb Data by City?
Airbnb data analytics refers to gathering big data related to Airbnb rentals then analyzing and interpreting it. It includes looking at all the crucial figures, percentages, and ratios that will help you understand how profitable investing in a vacation rental is or how much return on investment you can make. Since we’re looking at the data by city, it’s collected, analyzed, and classified by location.
There’s much more to Airbnb data than just numbers. Airbnb data analytics utilize traditional and predictive analysis to produce accurate forecasts for upcoming market trends. In short, it uses past and current data to make accurate projections.
You should access the latest and most comprehensive data if you want to become an Airbnb host.
Why Do I Need Airbnb Data by City?
Primarily, Airbnb data by city allows you to make data-based and smart business decisions with confidence. It is because the data allows you to identify the best cities for short-term real estate investment, as well as the top-performing listed properties in your preferred housing market. Another advantage of Airbnb data by city is that it helps you mitigate the risks associated with Airbnb investments.
Perhaps, the biggest advantage of Airbnb data and analytics is that ROI indicators help paint a clear picture of how your vacation rental will perform in the long term. It clearly demonstrates that obtaining access to Airbnb data by city will help you succeed in this rental strategy and put you ahead of your competitors.
How Can I Access the Most Reliable Airbnb Data by City?
As you can already imagine, compiling and analyzing this crucial data by yourself can be a stressful process. You don’t need to do it by yourself. Which is the best way, then, to access Airbnb Data by city?
As most smart real estate investors in the new age do, you must use the right tools and resources. However, you need to be careful. Not every site and platform claiming to be reliable provides accurate data and analytics.
It begs the question: What is the best platform to access Airbnb data by city and ensure you’re running an Airbnb business that generates positive cash flow?
While you must’ve come across many websites and platforms, Mashvisor stands out among its competitors. While it may seem like a bold claim, we got several reasons to support that. It’s the most ideal platform since Mashvisor’s Airbnb machine learning dataset and algorithm give you deep insights and reliable forecasts for Airbnb rentals in any real estate market in the US.
Additionally, the data is presented in a simple format, such that the average real estate investor will find it easy to analyze it. Any investor can find what they’re looking for in just a matter of minutes.
What Airbnb Data Does Mashvisor Give You Access to?
Investors who signed up to use Mashvisor have access to market-level and property-level Airbnb data.
Market-Level Airbnb Data
Market-level Airbnb data consists of the average performance of active Airbnb listings in the city and neighborhood.
Real Estate Market Data
If you want to invest in short-term rentals, you first need to research the best cities for Airbnb investment. Location is one of the most crucial factors when it comes to real estate investment. Not only does it determine the rate of return on investment, but it also influences the best rental strategy to pursue. Some cities are best for traditional long-term rental strategy while others do well for vacation rentals.
Real estate market data is essential because many cities across the US continue to pass and implement new Airbnb regulations. You’ll find such occurrences even in cities that are tourist hubs and typically the investors’ first choice for short-term investment property. Even if your options for such types of investments become limited, Mashvisor Airbnb data by the city will help you locate lucrative markets.
As a real estate investor, you should first research Airbnb regulations and look for locations where non-owner-occupied short-term rentals are legal. You can start by carrying out a quick search on Google to understand the condition of the tourism sectors and Airbnb demand in those locations.
After carrying out your Airbnb market research, you can now look at Airbnb data by the city to see what the actual data says about the cities. You can use the following metrics to filter the data:
- Median listing price
- Monthly Airbnb income
- Average Airbnb return on investment (cap rate and cash on cash return)
- Average Airbnb occupancy rate
So, how can you access said information on Mashvisor?
There are two ways to do it. To start with, you can visit our real estate investment blog. Here, you’ll find the latest and most reliable Airbnb data by city. In addition, we constantly keep our readers updated on the latest Airbnb rules and regulations in every city.
The second way to access Airbnb data by city is by accessing our Market Reports. The reports provide you with an in-depth market analysis of major cities in the US, including the Airbnb investment analysis already done for you. It will help you decide on the best location for Airbnb investing and help you make smart business decisions.
Neighborhood Data Analytics
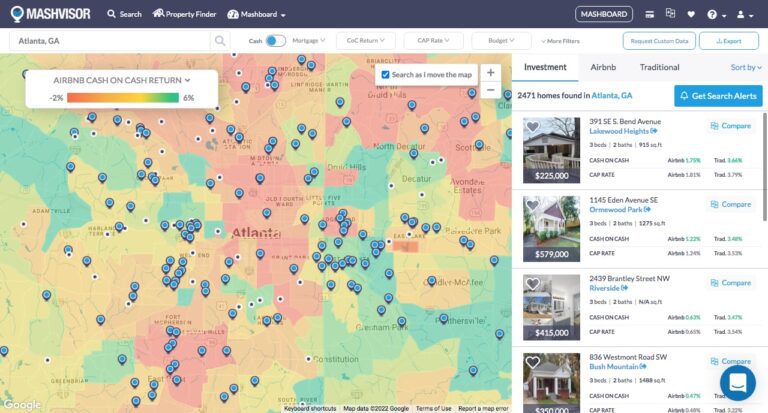
The quickest way to view the Airbnb data by city on Mashvisor is by turning on the real estate heatmap.
When we talk about location in real estate investing, we don’t only mean the city, but the neighborhood as well. Carrying out neighborhood analysis is important since two different neighborhoods within the same city may offer different potentials.
For example, some neighborhoods hardly see any travelers throughout the year. Such neighborhoods would be more suitable for the traditional rental strategy. On the other hand, some neighborhoods are close to tourist attractions, urban areas, and schools, making them ideal for Airbnb investments. Now, how will you know which neighborhoods within your city of choice are most suitable for Airbnb investing?
For starters, you can go a step further and look into tourist statistics for the particular neighborhoods you’re interested in. However, information can be hard to come by. It leaves us with one option: neighborhood data analytics.
If vacation rentals in a certain neighborhood show respectable performance in the past, predictive analytics will help you determine if the rentals will remain profitable in the future. You can access such information on our blog because we list the best neighborhoods to invest in Airbnb in different cities.
However, the best place to start is the Mashvisor Heatmap Analysis tool. The tool basically gives you an overview of what investing in different neighborhoods within a city looks like. You can also use different filters to analyze the different neighborhoods based on Airbnb analytics. You can play around with the filters and identify the most profitable neighborhood for Airbnbs in your preferred city.
Remember, you want to find a neighborhood with a listing price that’s within your budget, profitable Airbnb income, attractive cash on cash return, and a high Airbnb demand (occupancy rate). This Airbnb dataset combination will help you discover an area where you can afford an Airbnb investment that also promises a high return on investment.
Property-Level Airbnb Data
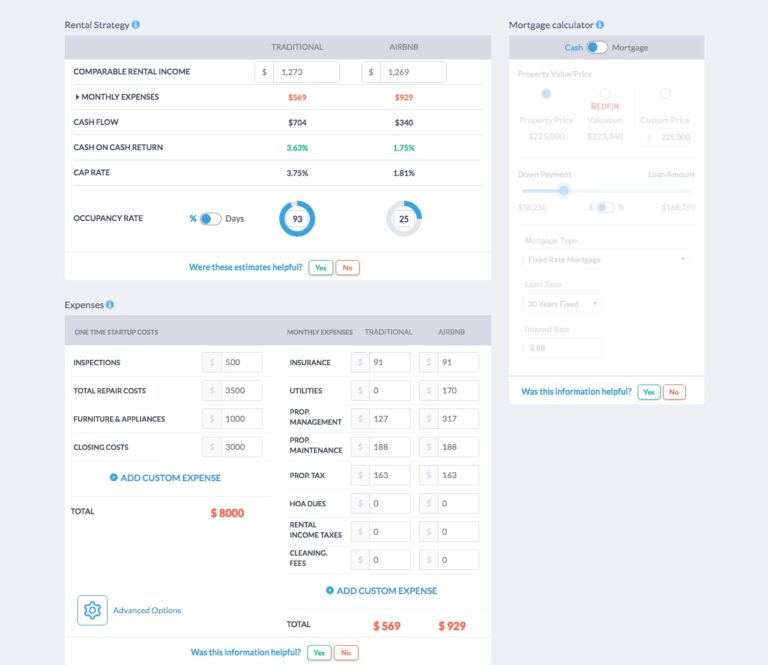
Mashvisor’s Airbnb calculator lets you project your cash flow, cash on cash return, and cap rate by entering your estimated income, mortgage, expenses, and occupancy rate.
Once you’ve accessed Airbnb data by city, it’s now time to analyze the investment property itself. By this time, you probably have a list of a few suitable cities you intend to invest in. Fortunately, by using our Airbnb analytics platform, the next step is pretty much straightforward.
Mashvisor has an Airbnb Calculator that grants you access to different types of data that every real estate investor needs to conduct an investment property analysis.
Airbnb Rental Income
In the short-term rental market, you just can’t charge any rate you feel like. A high nightly rate will push clients away, given the cheaper options available elsewhere, while a lower rate will mean your business won’t be profitable enough after settling monthly bills. You want an Airbnb pricing strategy that takes into account the occupancy rate, expenses, and local rental listings.
Mashvisor’s Airbnb Calculator provides all the said data. The platform considers comparable properties’ rental income and uses them to estimate your property’s rental income. However, remember that the results are just estimates, not a given. You can decide for yourself based on the given figures.
Airbnb Return on Investment
Return on investment is one of the most crucial datasets for an investor. You can’t tell how much you can make from your investment by merely looking at it. You must collect various data and ensure your numbers are accurate.
After that, you must run the numbers using different calculations on the rate of return on rental property. The process includes using the cash on cash return and cap rate formula. If you do the calculation manually, it’s easy to mix up the numbers and come up with inaccurate estimates. It means you can end up making the wrong investment decisions.
As such, you need a tool that puts Airbnb data to work and calculates return on investment metrics, such as cap rate and cash on cash return, with the power of predictive analytics. This is where Mashvisor’s Airbnb Profit Calculator comes in. The calculator determines the cap rate and cash on cash return for each property using predicted real estate data.
Cash on cash return is the ratio between a property’s cash flow and the total cash investment. You can change the total cash investment using the platform’s built-in mortgage calculator, covering your down payment, closing expenses, and renovation costs. As for the cap rate, it’s the rate between cash flow and the property’s purchase price (you don’t need to include the finance information)
Mashvisor offers information on return on investment for both traditional and short-term rental strategies. It helps you choose the best rental strategy for your investment. In short, you’re assured that the property you’ll invest in offers a higher Airbnb return on investment than a traditional ROI.
Airbnb Rental Comps
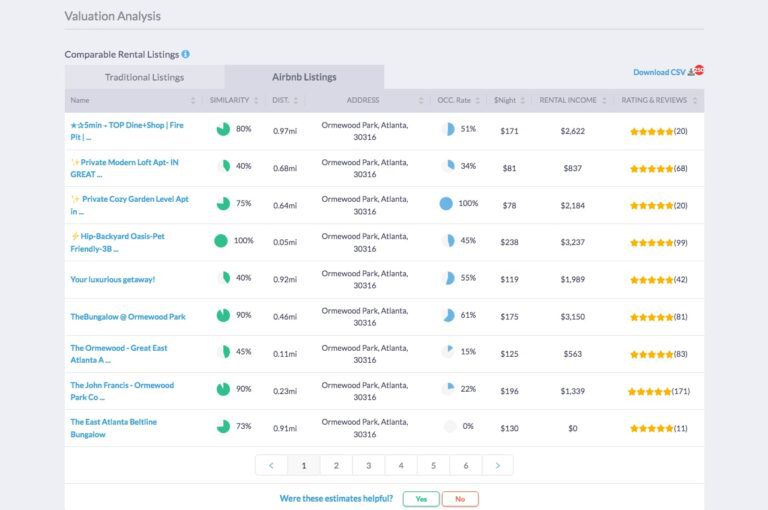
Included in every listing page is a section containing similar Airbnb properties to help you assess the potential demand and income you can earn with the listing you are looking at.
Access to Airbnb rental comps not only helps you determine the property’s market value but also sets the correct nightly rate. Airbnb comps involve gathering Airbnb data for every comparable short-term rental like yours in the market. Doing it manually is not only difficult but is also prone to errors.
The best Airbnb analytics platform is going to provide you with Airbnb comps. Mashvisor does exactly that. You don’t need to go through all the trouble as you can access readily available Airbnb comps for any listing on the platform.
Airbnb Cash Flow
When it comes to any investment, real estate included, cash flow is king. Cash flow in real estate is primarily the rental income minus the expenses. The amount left is the profit that goes into your pocket. As a real estate investor, you want to invest in properties that provide you with a positive cash flow. It means that the Airbnb income outweighs the expenses.
Since you can access Airbnb data by city on the Mashvisor platform, you don’t have to calculate the cash flow manually. The Airbnb Income Calculator takes all the Airbnb data and calculates the numbers. Once you click on a property that interests you, you can immediately tell whether it offers the Airbnb income potential to make positive cash flow.
The Mashvisor platform also gives you access to the following dataset:
- Airbnb costs and fees
- Airbnb occupancy rate
- Data on Airbnb reviews
- Airbnb investment payback balance
Access the Most Reliable Airbnb Data by City Today
At this point, you know what Airbnb data is and how you can access Airbnb data by city. Luckily, all this crucial data is only a click away. Sign up for a 7-day free trial and access all our real estate investment tools.