With Mashvisor’s Investment Property Finder tool, your search for investment properties can be made from the comfort of your own home.
Find Properties That Perfectly Meet Your Investment Criteria
No more time wasted on driving around looking for sale-signs.

Search The City of Your Choice
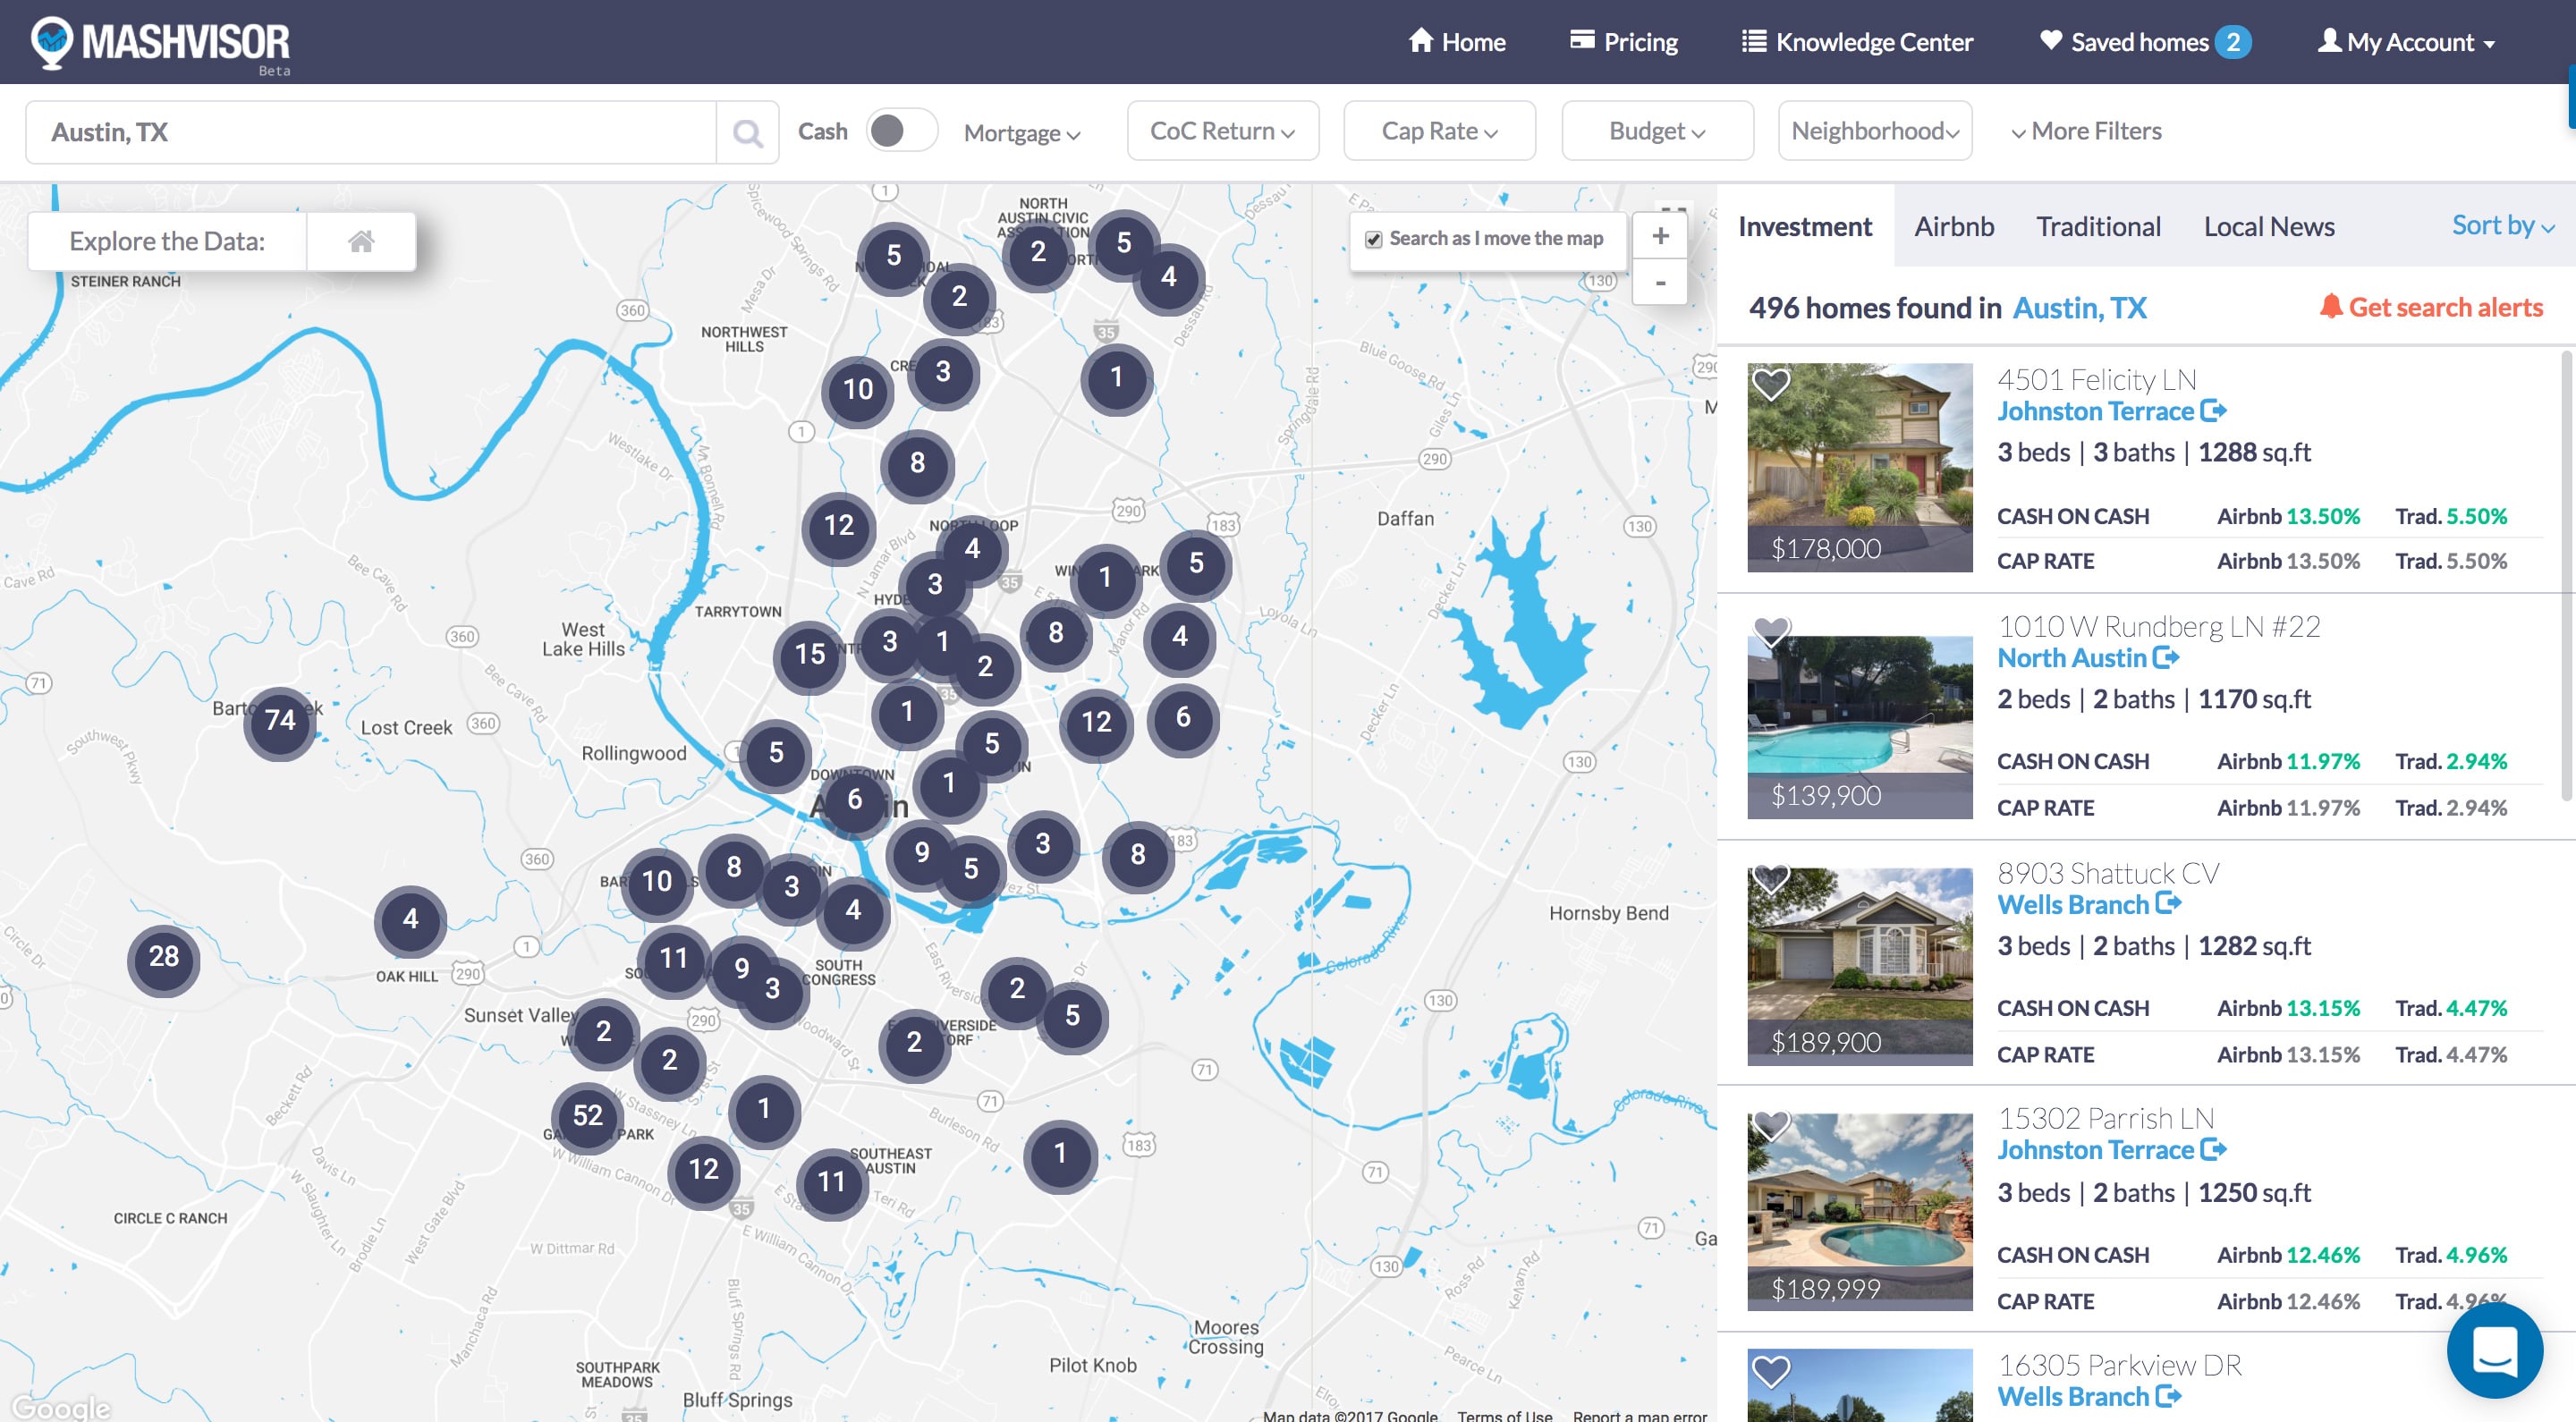
Using our search engine, typing the name of the city that you’re interested in will give you quick and informative results for your search, allowing you to find properties easily in your city of choice:
- A map showcasing the neighborhoods in that city and the number of investment properties within each neighborhood.
- Hover over any neighborhood to get a quick idea of that neighborhood’s stats, such as its average Cap Rate, Cash on Cash Return, and Median Prices.
- Filter out any unwanted results using our great variety of search filters based on your investment and search criteria.
Easy-to-Navigate, Easy-to-Learn
The Mashvisor Investment Property Finder tool might seem intimidating at first due to the amount number of data and information that is being showcased. To make it easier, the tool has been divided into different sections that are easy to navigate and to help you find properties that are suitable for you:
- Top-bar: includes all search filters, allowing you to filter out investment properties that do not meet your search criteria.
- Right-side-panel: includes the list of properties in the area, allowing you to switch between investment, traditional, and Airbnb rental properties.
- City-map: includes all neighborhoods within the city, displayed as little circles, with the numbers inside each circle indicating the number of properties within that neighborhood.
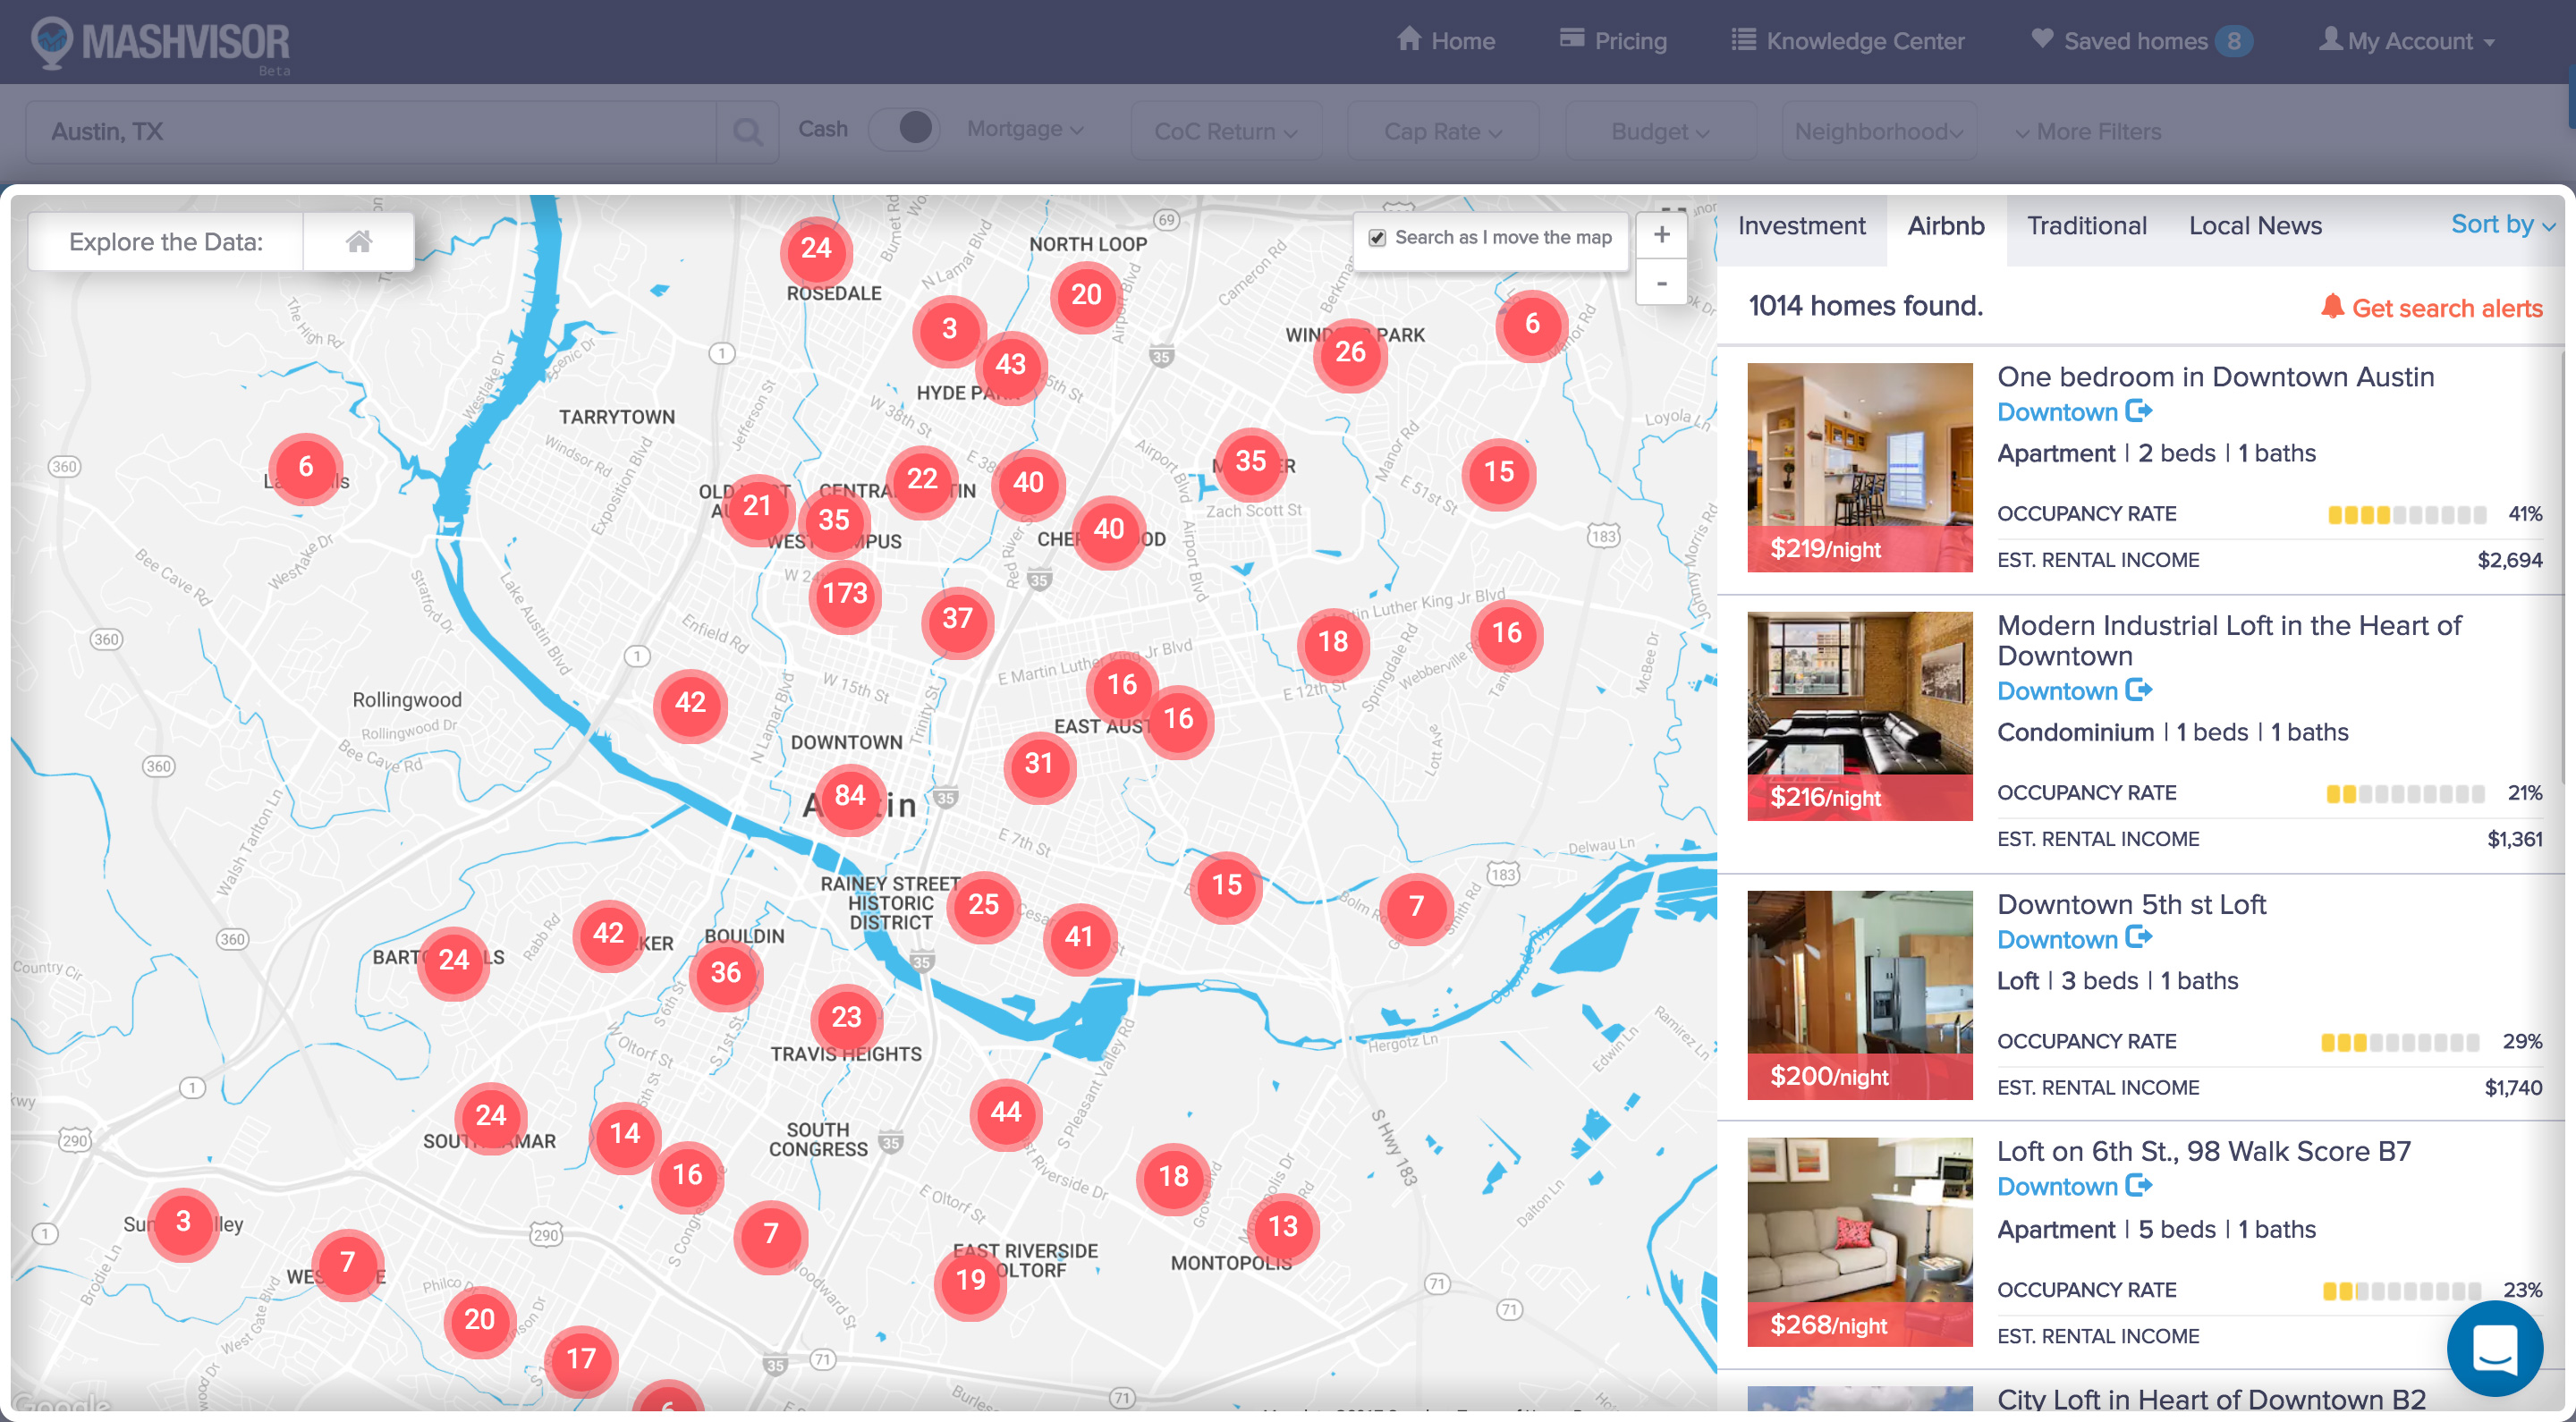
Dive Deep Into the Neighborhood Level
Clicking on a neighborhood will immediately take you to a map of the neighborhood, displaying all investment properties within that neighborhood, as well as the neighborhood’s stats, allowing you to find properties in the optimal neighborhood of your choice:
- The average median price of properties.
- Traditional Cash on Cash Return
- Airbnb Cash on Cash Return
- Traditional Rental Income
- Airbnb Rental Income
- Airbnb Occupancy Rate
- Optimal Strategy (Traditional/Airbnb)
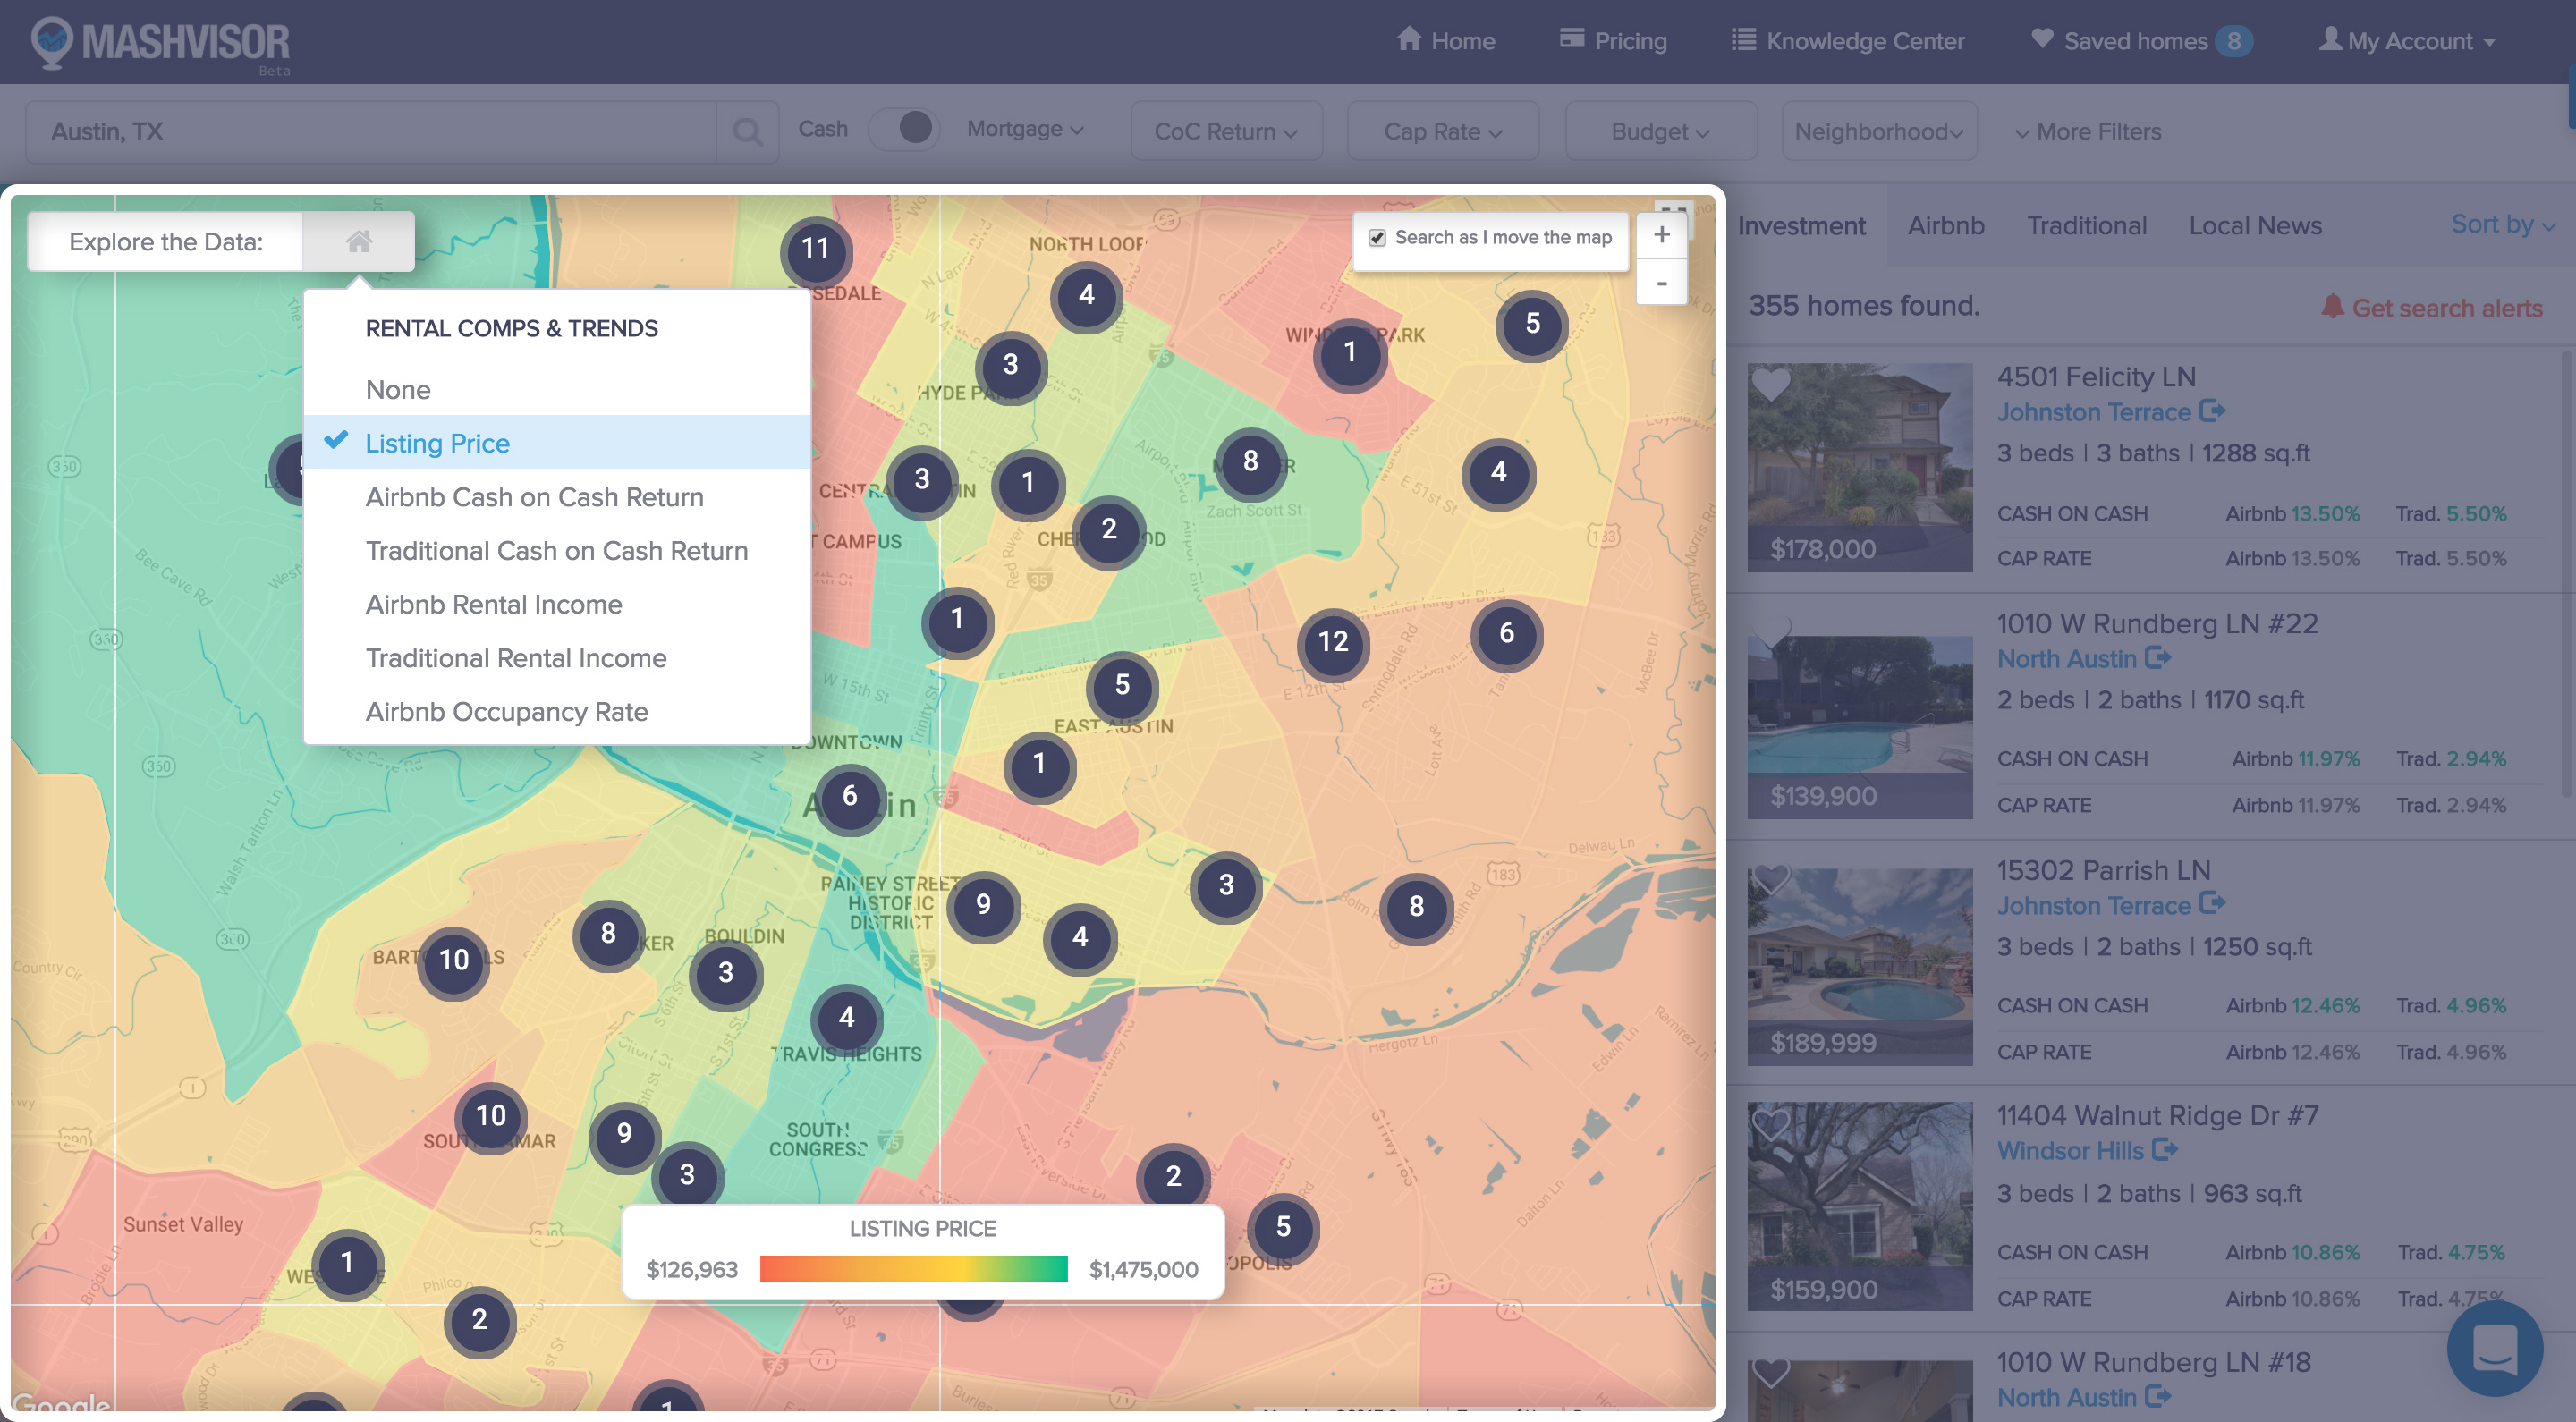
Get Visual With the Heat Map Tool
Clicking the Explore Data button at the top left corner of the map will give you a drop-down list to choose from a number of different metrics, transforming the view of the map into a heat map function, allowing you to easily determine the best performing areas based on your metric of choice:
- Choose a metric from the list: listing price, Airbnb/traditional CoC, Airbnb/traditional rental income, or Airbnb occupancy rate.
- An easy-to-read meter that indicates how “hot” or “cold” an area is based on the chosen metric.
- Find properties faster by eliminating entire areas that do not meet your investment criteria.
Are You Looking for a Clue?
If you’re here as a part of our Easter Egg Hunt campaign, then the clue you are looking for is — ORANGE!
At the end of our campaign, you will be asked about the colors of the eggs that you’ve found. Make sure not to forget these colors, as each will be worth an additional 5% discount FOR LIFE!
Ready to close faster?
Start your 14-days-trial now and see Mashvisor in action!