Real Estate Analytics

Made Easy

Obtain real estate analytics to identify your next investment opportunity quickly and with ease!

Sign up and gain access to hundreds of thousands of investment properties nationwide, and join our expansive network of real estate investors, agents, and professionals.

real estate analytics

Real Estate Analytics

Mashvisor specializes in real estate analytics. We provide our users with highly valuable and accurate real estate analytics and data comps that can help them identify the optimal investment opportunity for them to invest in. Mashvisor provides real estate analytics related to investment properties, with a focus on rental properties, as well as real estate analytics for any neighborhood or area to help real estate investors conduct a market analysis and research the market for the best performing investment properties based on a number of important aspects and metrics:

Real Estate Analytics

Investment Property Real Estate Analytics

When you start using Mashvisor, you will gain access to a wide variety of tools and features that will make your search for the optimal investment strategy easier than ever before. Using Mashvisor, you will be able to obtain real estate analytics and data related to the investment property that you’re interested in to determine its profitability and potential for investment, allowing you to identify the best investment properties anywhere in the US. Mashvisor will give you access to:

  • Investment Property Analytics
  • Investment Property Cap Rate and Cash on Cash Return
  • Optimal Rental Strategy: Airbnb vs Traditional
  • Rental Property’s Airbnb Occupancy Rate
  • Investment Property Status: For Sale, Sold, Pending, Foreclosed
  • Property’s Size, Number of Bedrooms/Bathrooms, Age, and Square Footage
  • Rental Property’s Rental Income
Real Estate Analytics

Neighborhood-Level Real Estate Analytics

One of the unique features of Mashvisor is that it gives you access to real estate analytics on a neighborhood-level. Meaning, with Mashvisor you will be able to do a competitive market analysis and research your neighborhood of choice with ease and using very little time. Our neighborhood real estate analytics will provide you with all the data comps that you need to identify your next investment property in your neighborhood of choice. The neighborhood analytics and data comps include:

Real Estate Analytics

Export Real Estate Analytics Reports

Mashvisor also allows you to export easy-to-read reports for both the investment property and the neighborhood real estate analytics. This is a great tool to utilize for sharing the information and the data with a friend, a family member or a real estate agent and to get a second opinion on an investment property or the neighborhood that you want to invest in. The investment property report will include all of the data and real estate analytics that are included in the property analytics page on the platform, all in an easy-to-read PDF format. The neighborhood report is an Excel sheet report containing all the data comps related to the investment properties in the area. This tool is great for comparing a large number of investment properties with ease to identify the ones with the highest potential for investment.

Real Estate Analytics

Real Estate Analytics: Tools, Calculators, and Filters

All of the features mentioned above can be easily used, customized, and utilized using a wide variety of tools that are all part of the platform. Whether you’re using the search page, the investment property page, or the neighborhood analytics page, you will gain access to a number of tools, filters, and calculators:

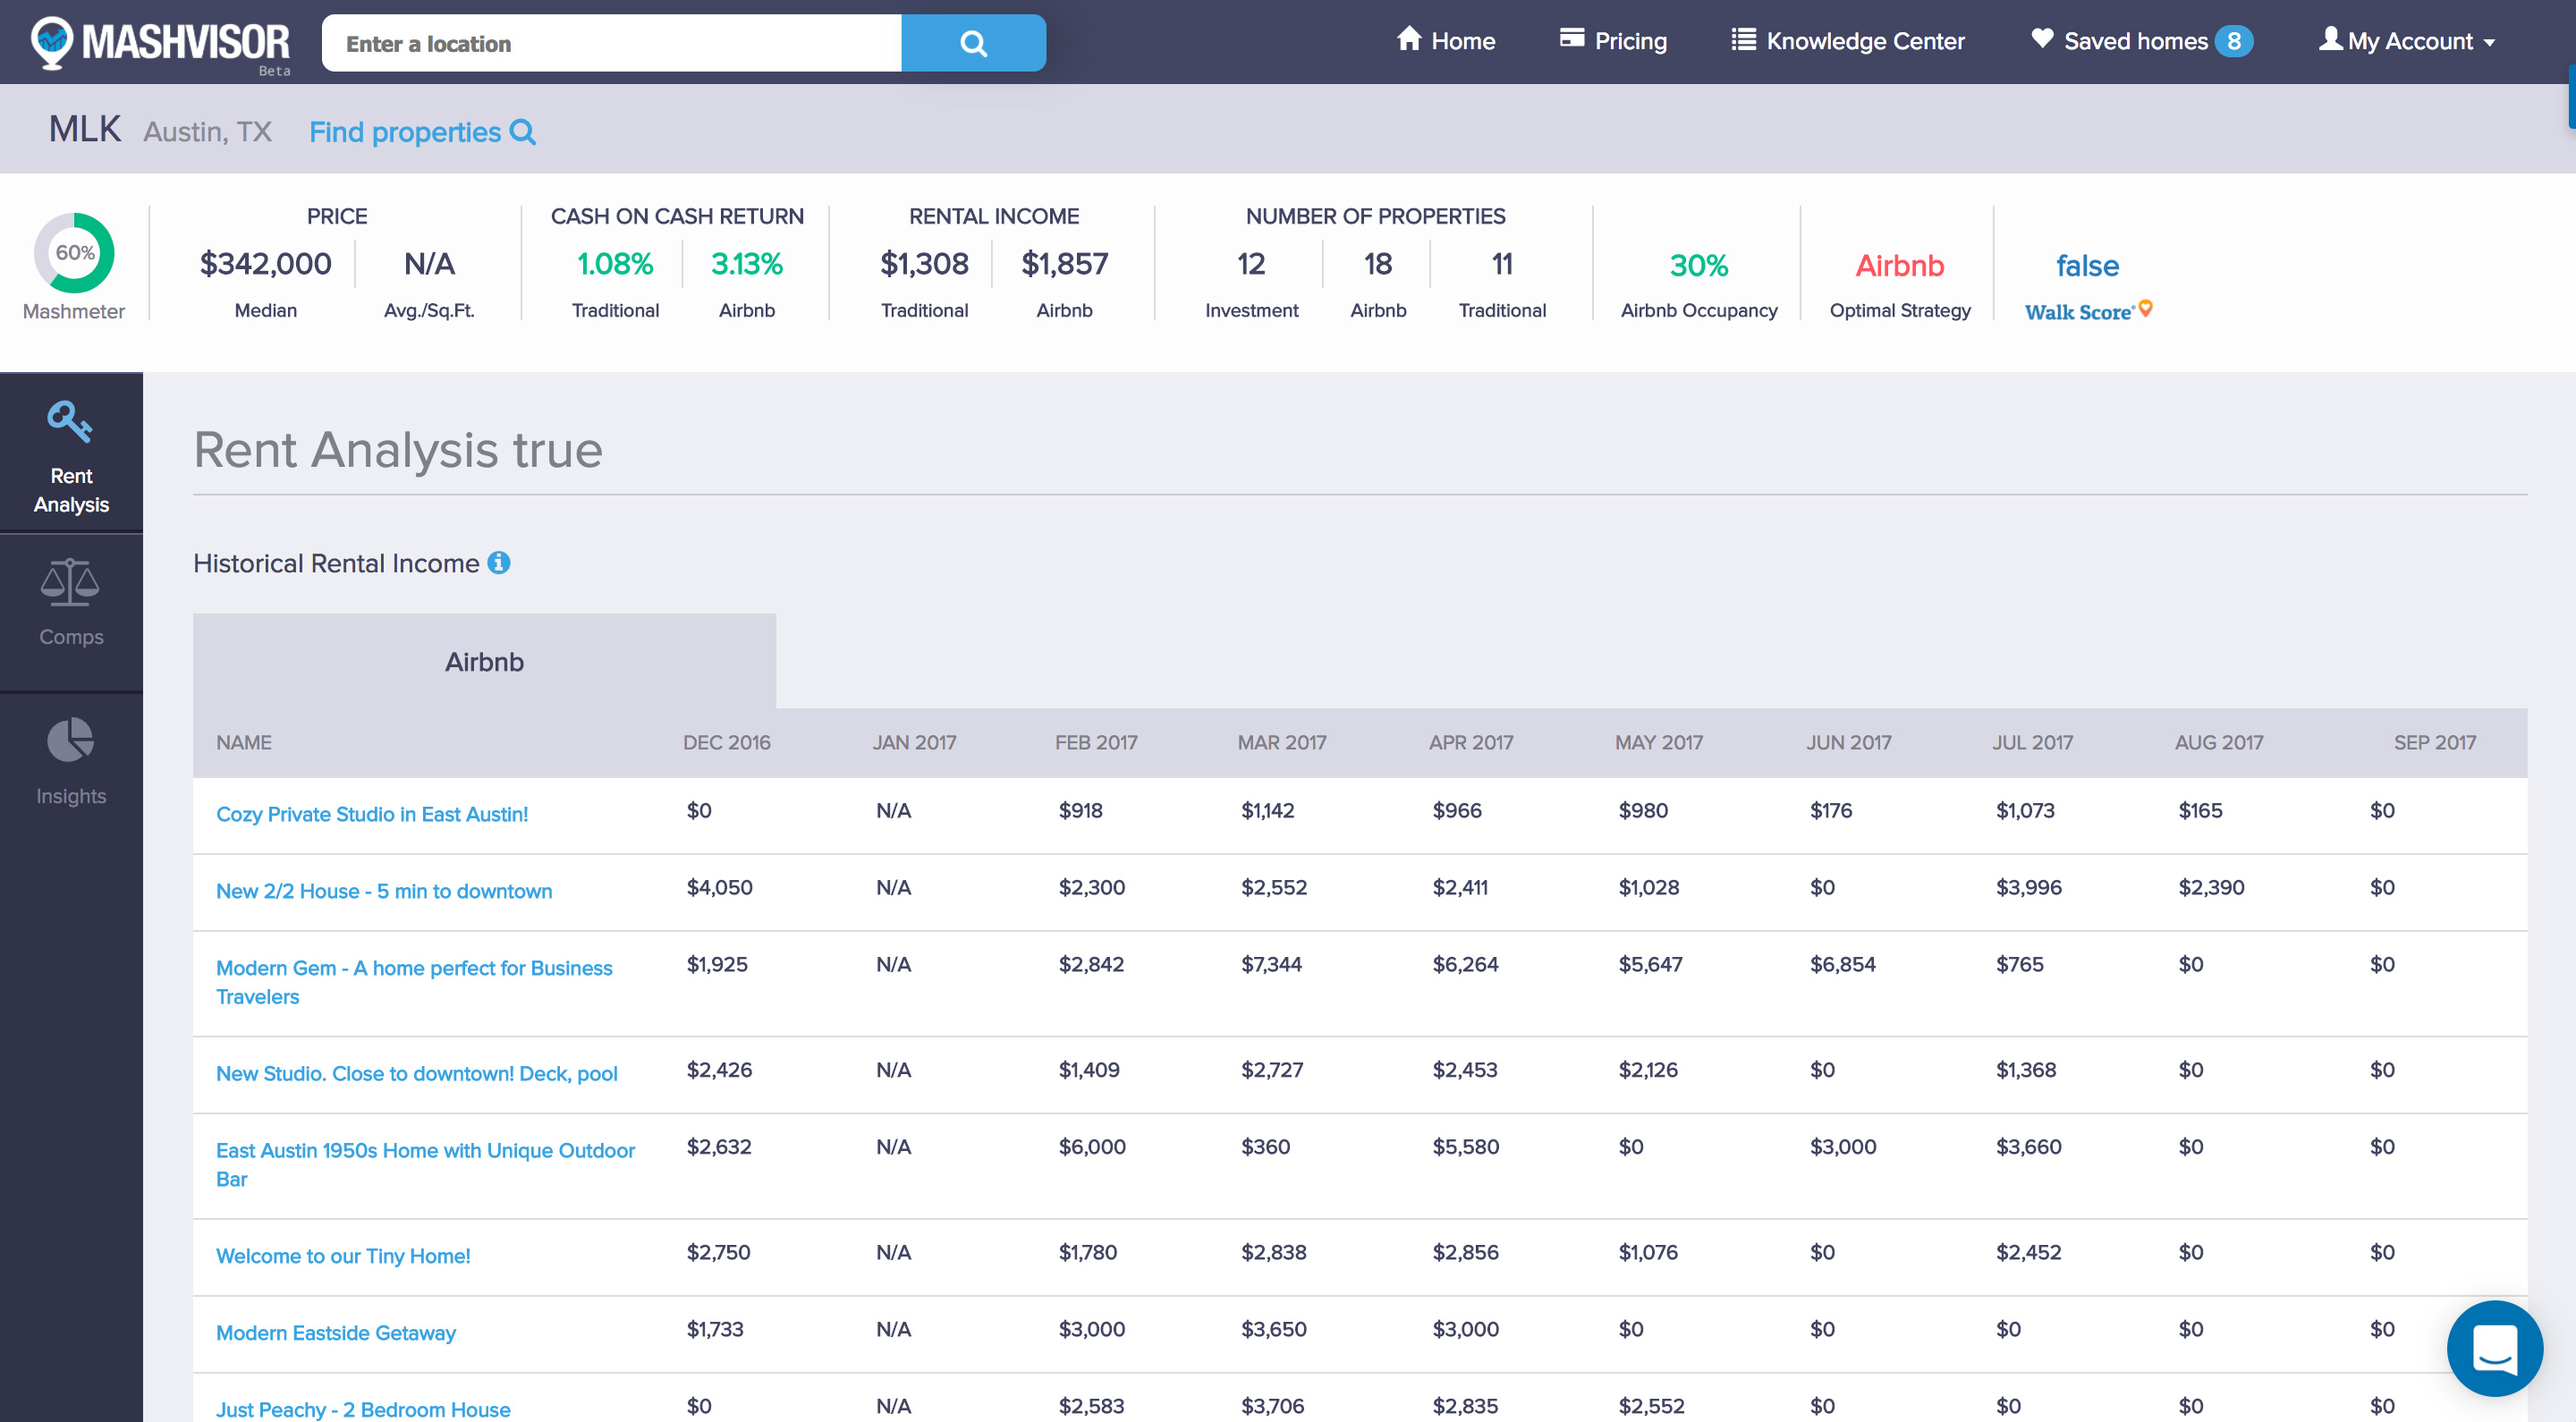
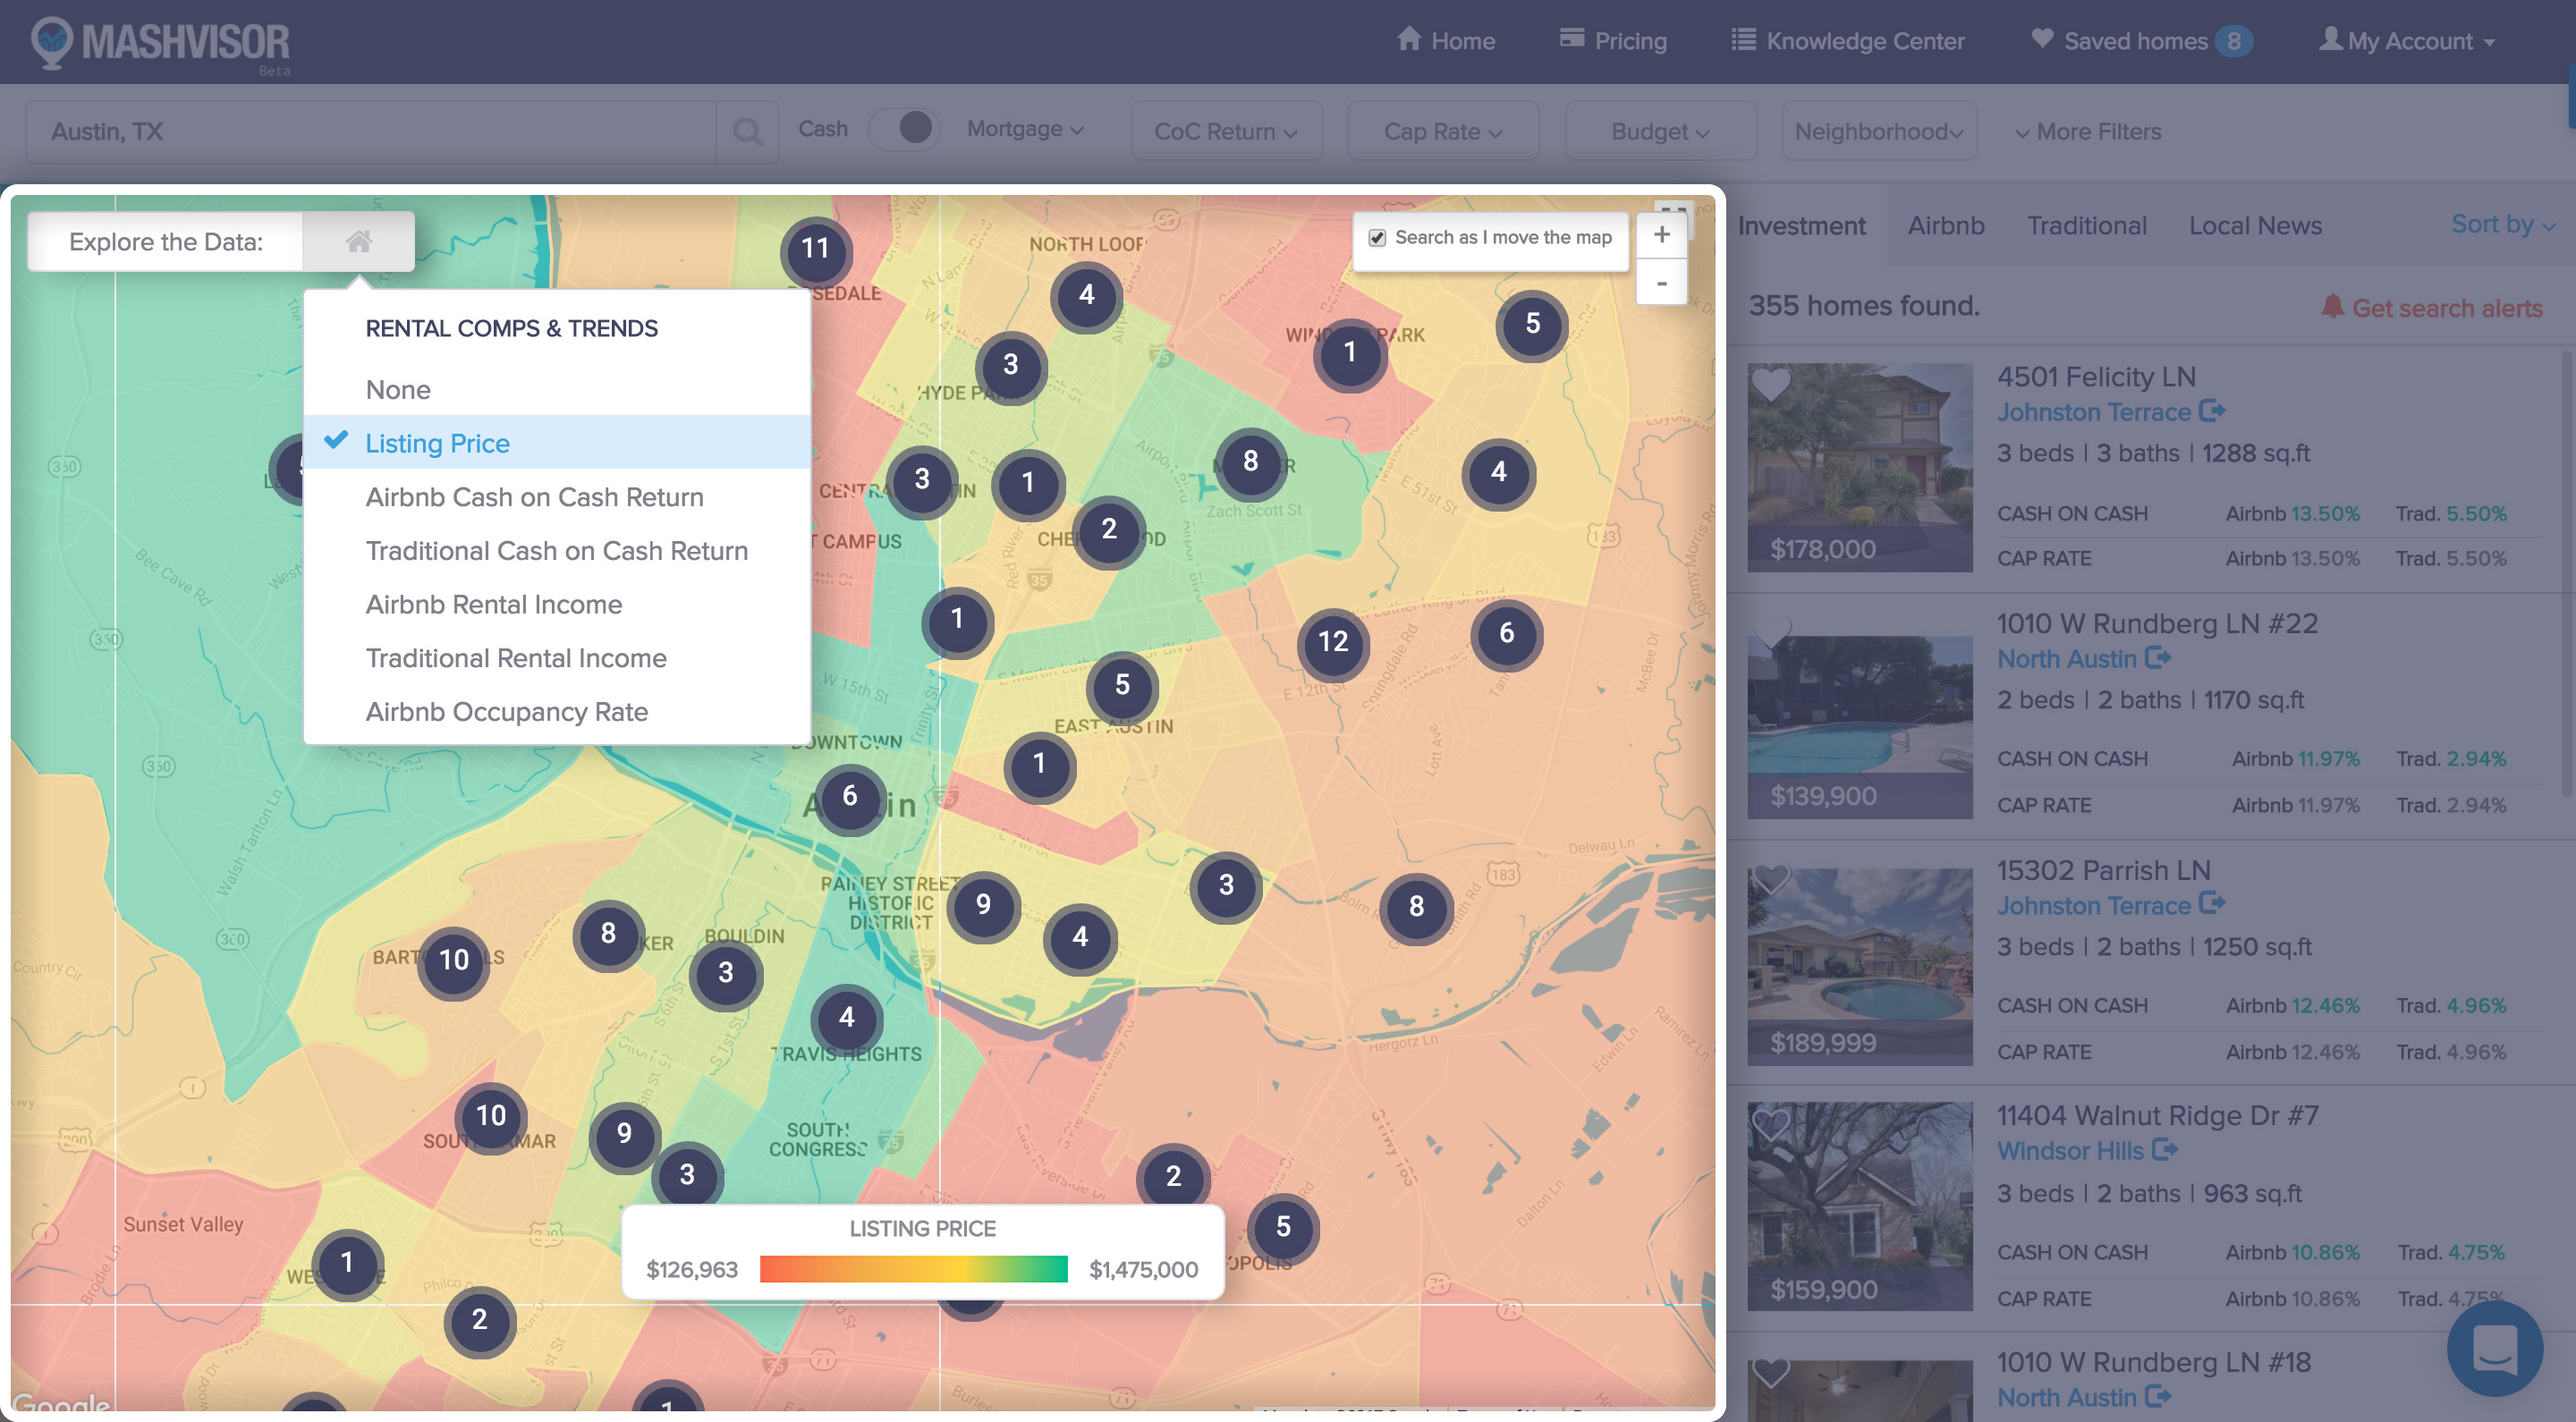
  • Heat map functionality to search your area of choice for investment properties using visual cues and indicators (heat meter) based on your filter of choice: traditional or Airbnb cap rate, traditional or Airbnb cash on cash return, Airbnb occupancy rate, rental property’s rental income.
  • Search page filters that will allow you to filter out the results based on your search criteria. The filters include: cap rate, cash on cash return, price, age, size, rental income, property status, rental strategy.
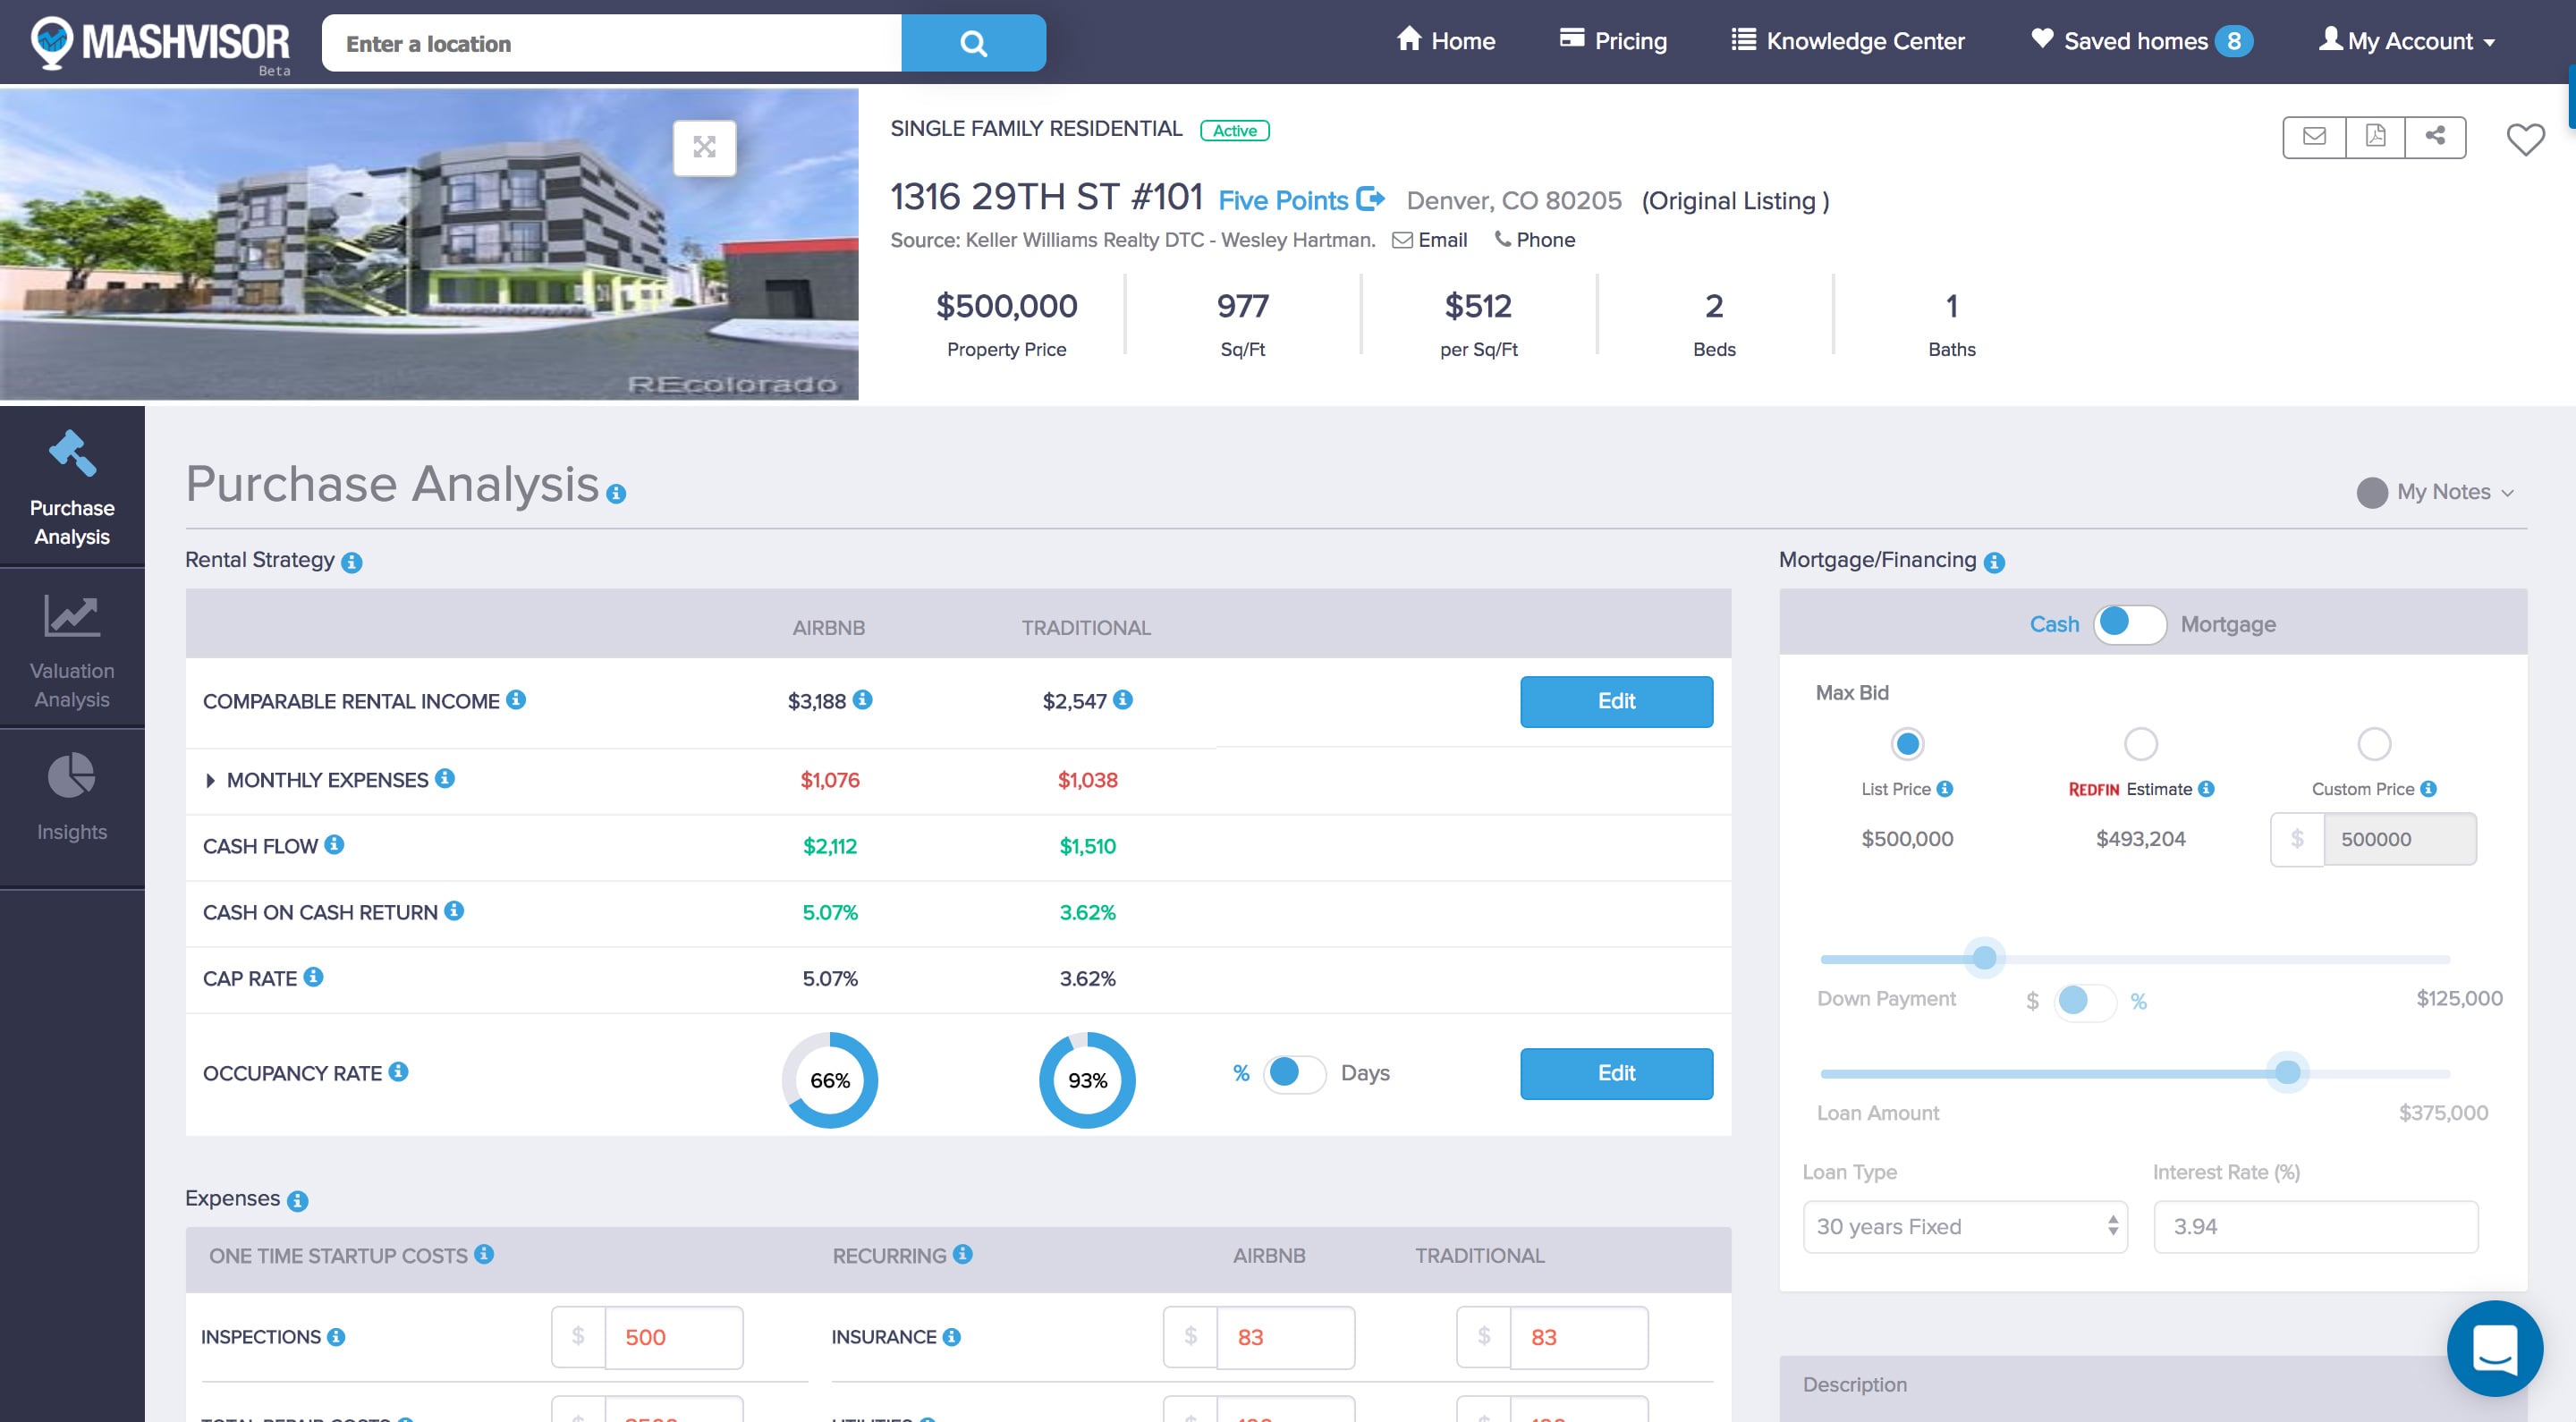
  • A calculator tool that allows you to calculate and modify the results for each metric (cap rate, cash on cash return, rental income, occupancy rate, cash flow) based on the different expenses (startup costs and recurring costs) or the method of financing (cash vs mortgage, type and duration of the mortgage, and the interest rate of the mortgage).

Who is using Mashvisor?

First Time Real Estate Investors

New real estate investors usually don’t know where to begin their research. Mashvisor helps an investor quickly understand and analyze any city or neighborhood’s average investment performance. Investors are able to save time selecting the optimal area for investing and can save months worth of research deciding on this alone.

Experienced Real Estate Investors

Investors that are looking for their next property are used to analyzing their returns and having built many spreadsheets in the past. Mashvisor automatically calculates the returns of a property for the investor so that they never have to use a spreadsheet again.

Real Estate Brokers/Agents

Real estate brokers and agents now have another place to advertise their properties. They can place their listings in front of investors and Mashvisor’s data helps the property better appeal to clients.

Ready to close faster?

Request your free demo now!