Use predictive real estate analytics to determine the most suitable neighborhood for your investment strategy
Obtain neighborhood analytics for easier than ever search results!
No more driving around, no more manual comps!
Neighborhood Analytics Made Easy
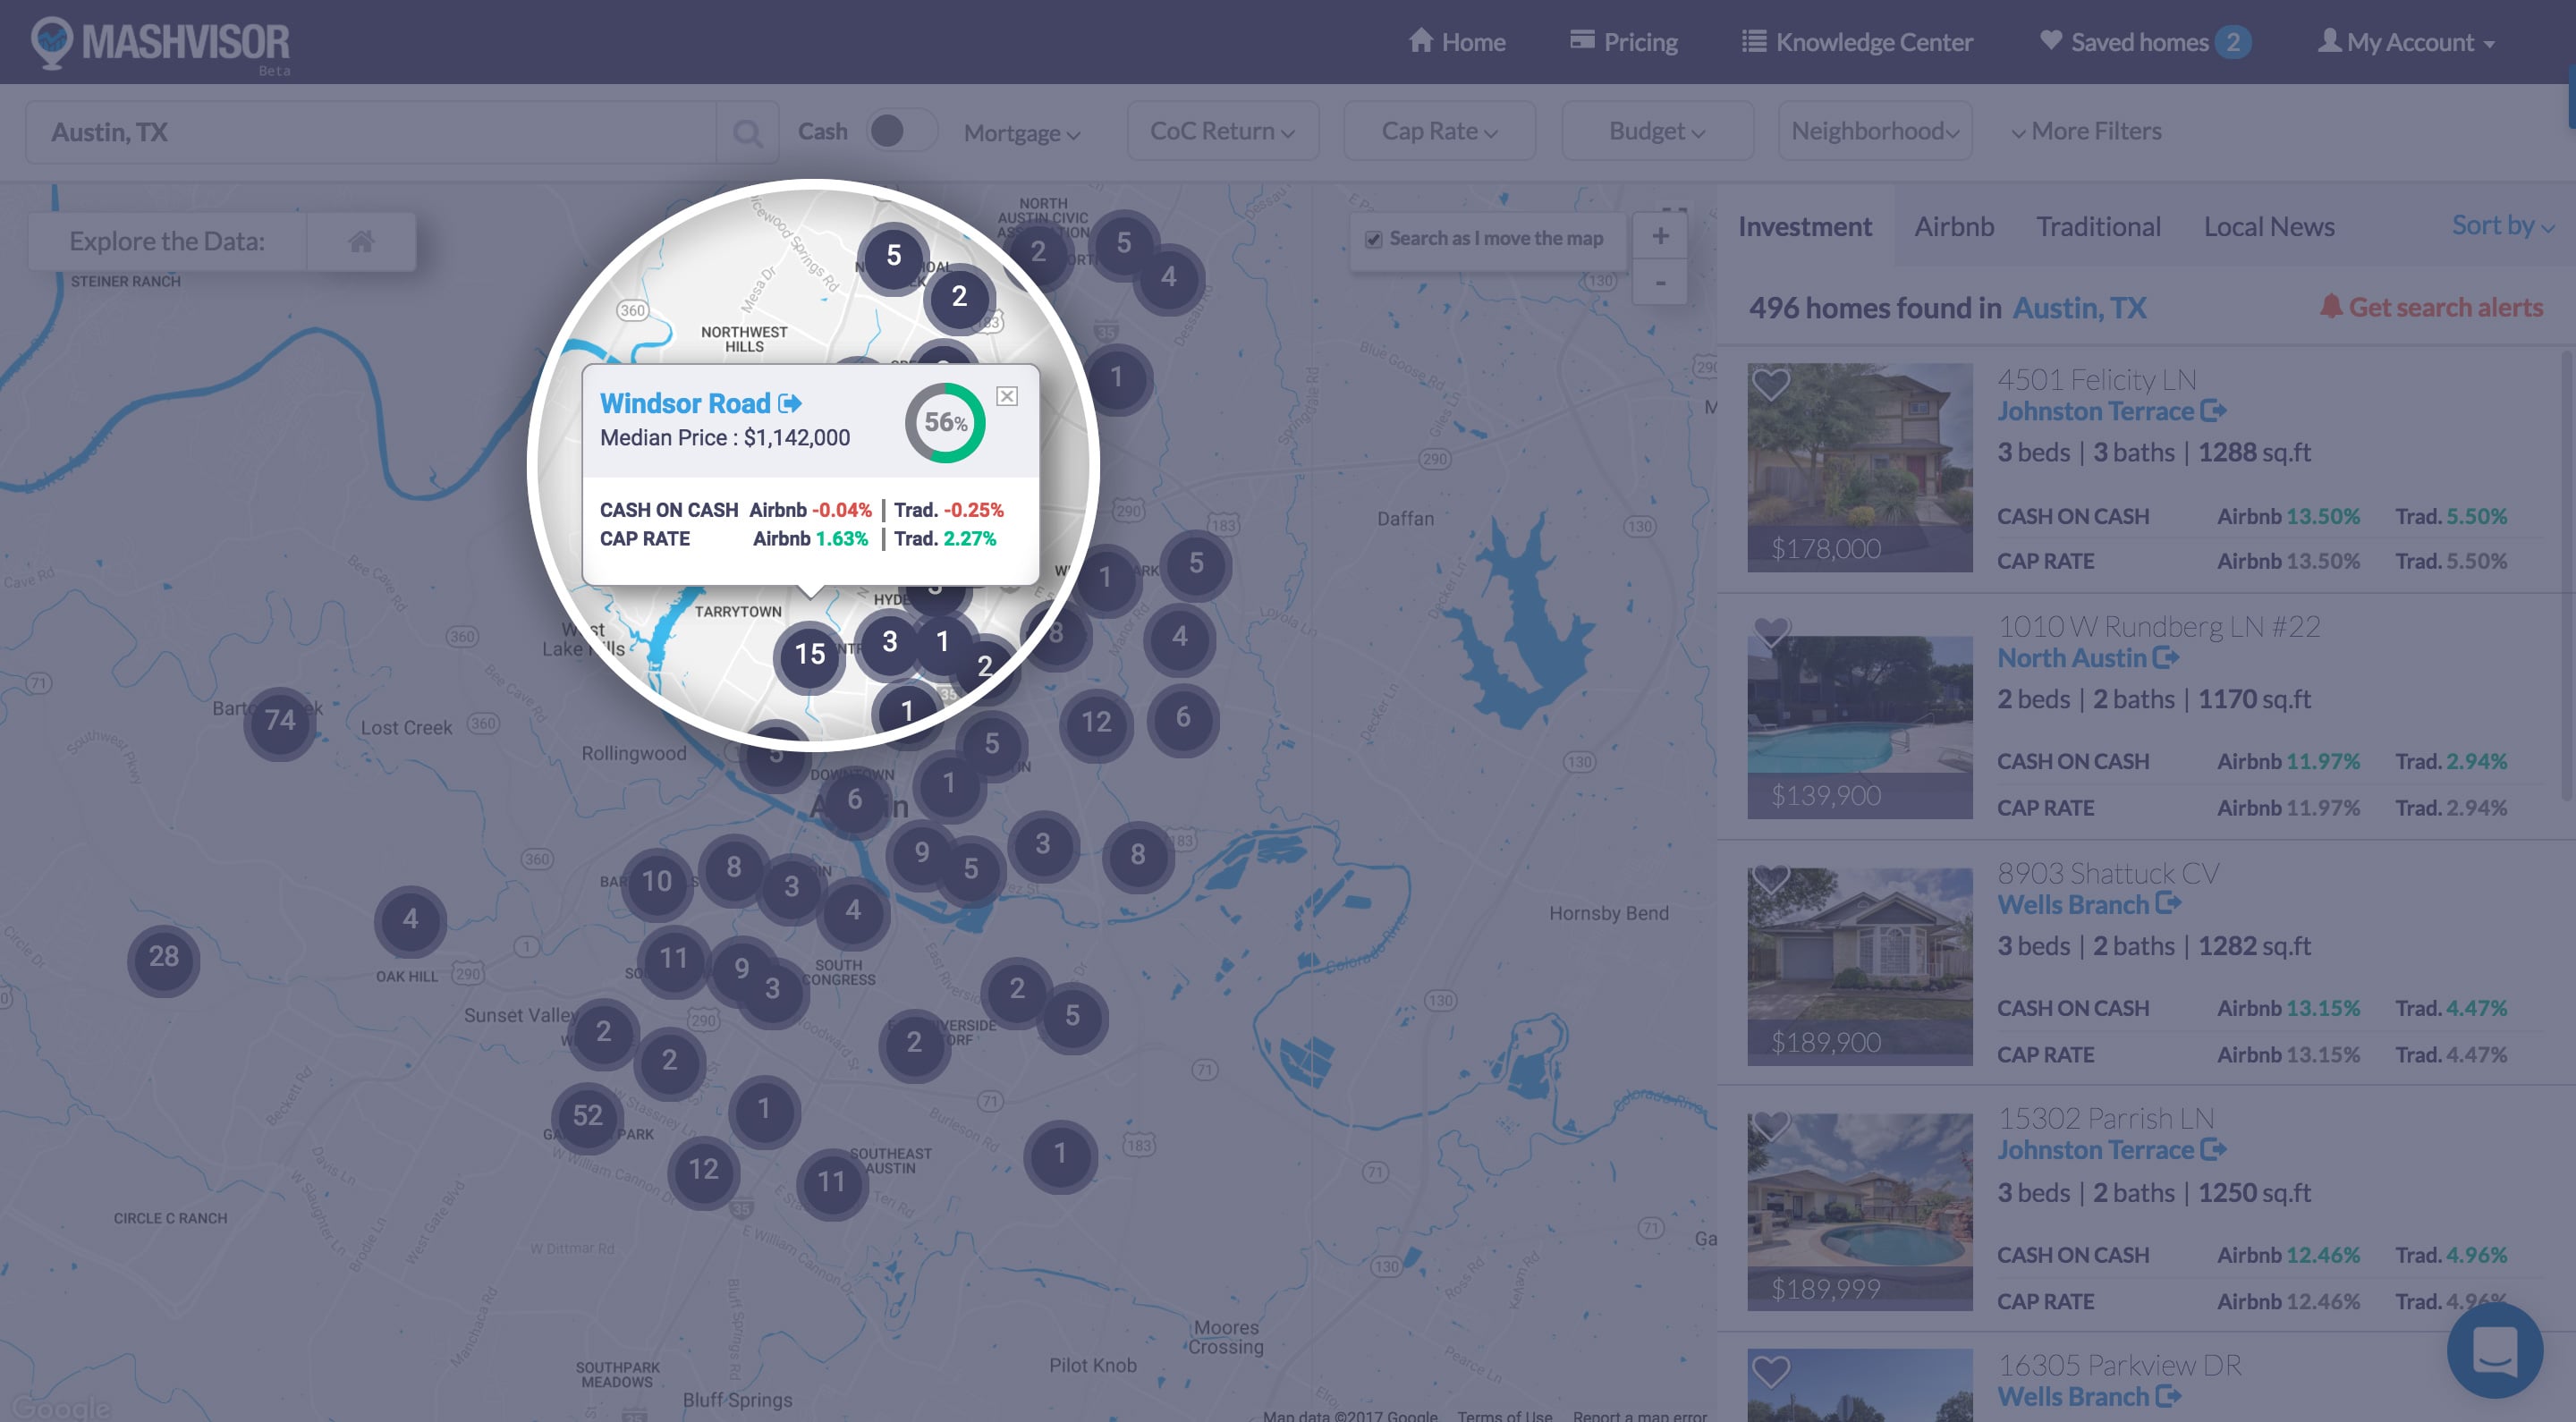
If you’re using our platform to search for an investment property in the city of your choice, hovering over any neighborhood in that city will give you the brief stats for that neighborhood:
- Mashmeter Score
- Median Prices
- Traditional and Airbnb Cash on Cash Return
- Traditional and Airbnb Cap Rate
Click Here to learn about our search filters!
Neighborhood Stats
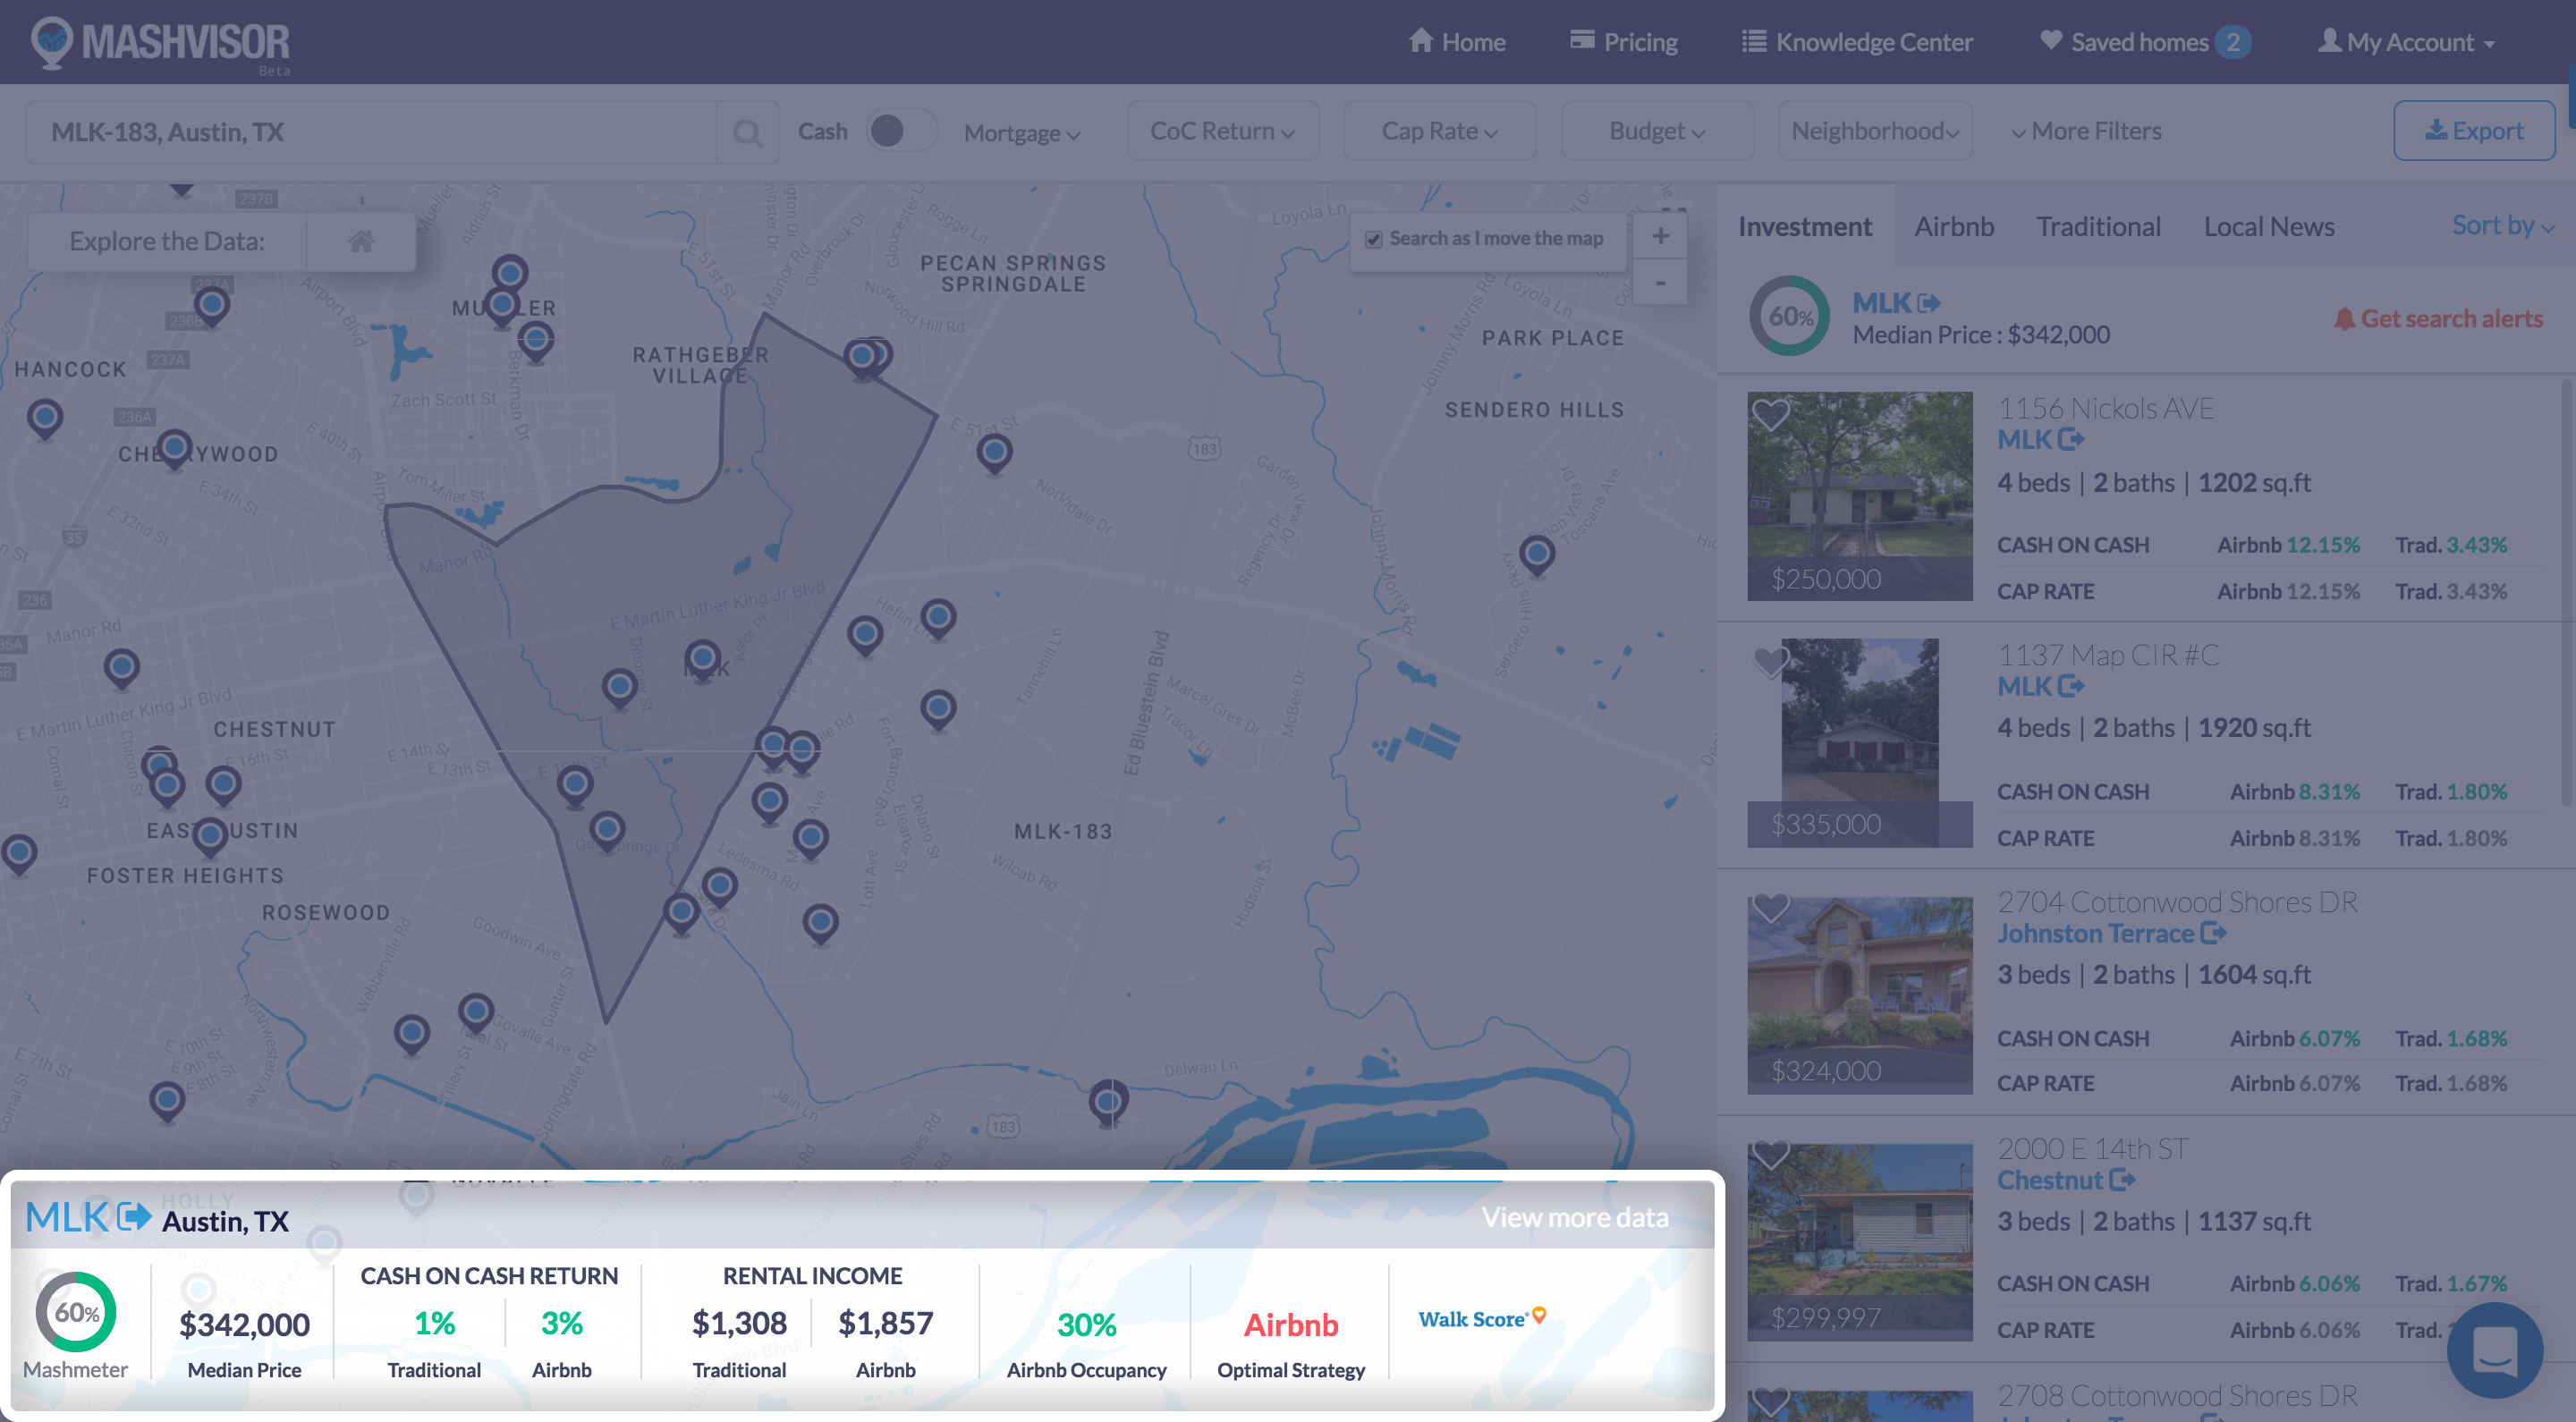
Clicking on a neighborhood will take you to that neighborhood’s map, indicating all investment properties in that neighborhood, and giving you more detailed stats of that neighborhood:
- Mashmeter Score
- Median Price
- Traditional Cash on Cash Return and Cap Rate
- Airbnb Cash on Cash Return and Cap Rate
- Airbnb Occupancy Rate
- Optimal Strategy (Airbnb or Traditional)
Click Here to learn more about becoming a Real Estate Investor with Mashvisor!
Neighborhood Analytics Page
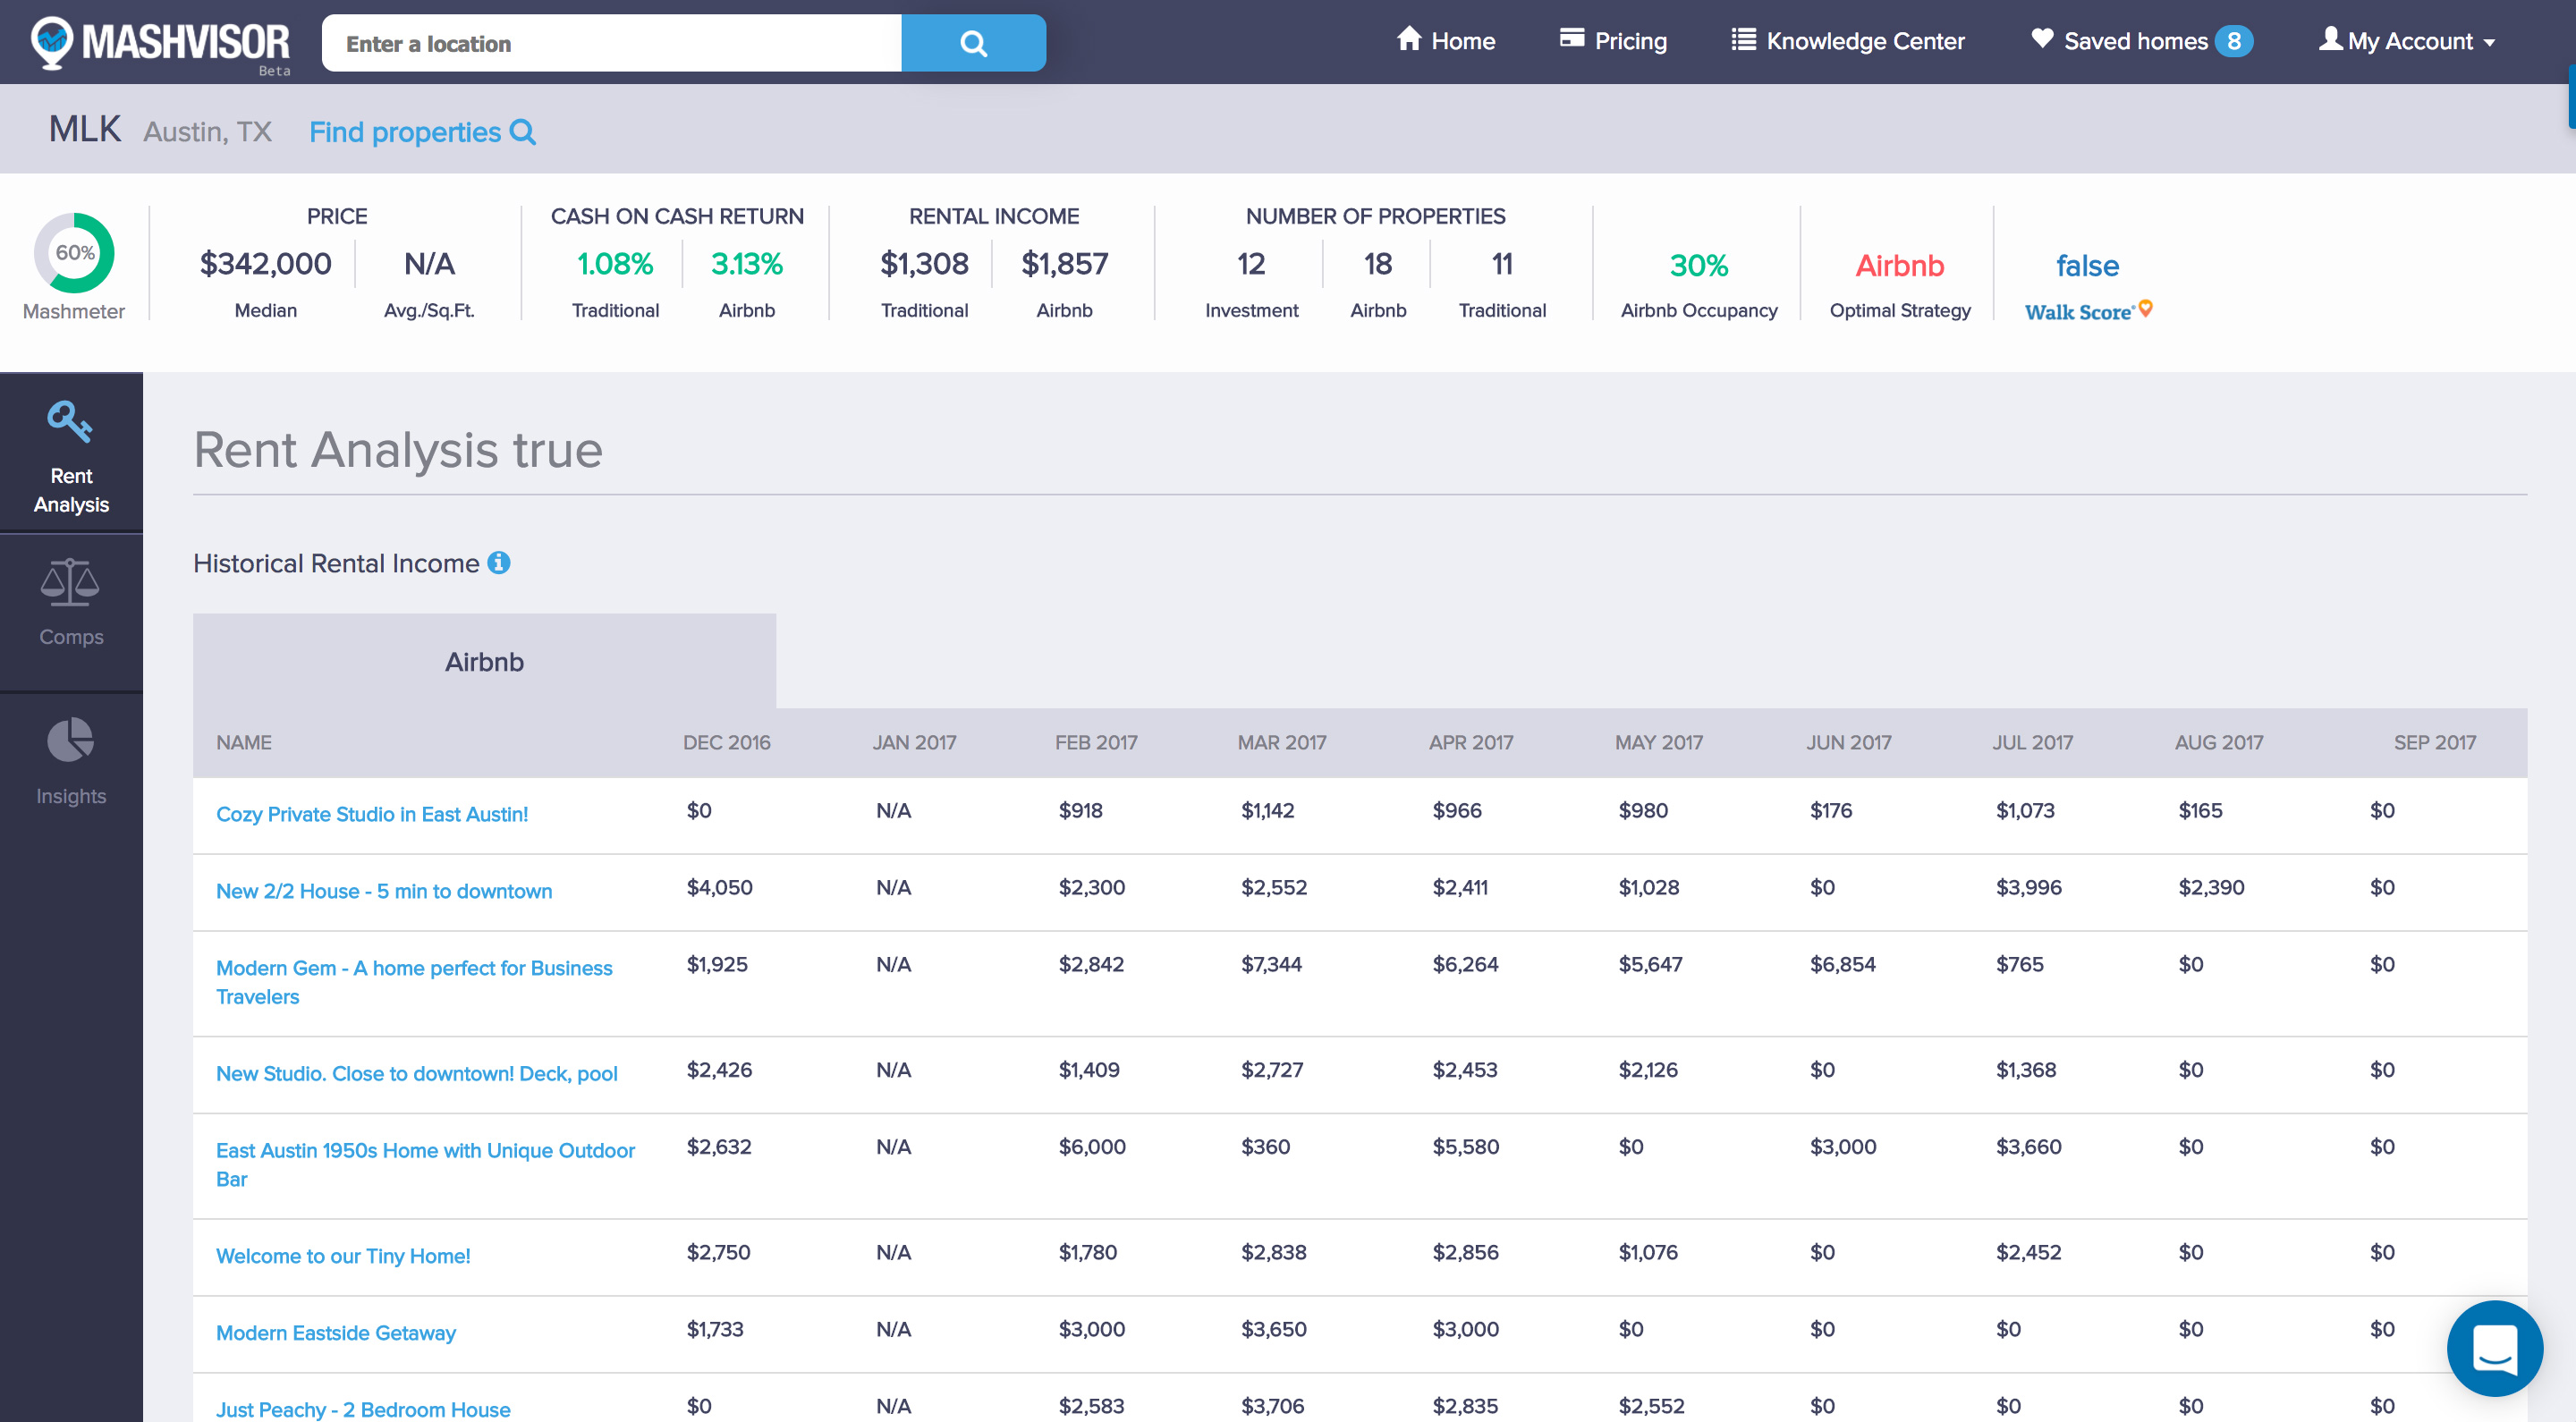
Clicking on a neighborhood’s name will take you to that neighborhood’s analytics page, which includes all of the information that you need to know about that neighborhood:
- Neighborhood Stats
- Historical Rental Income
- Neighborhood Comps
- Neighborhood Insights
Click Here to learn more about Mashvisor’s Investment Property Analytics!
Where Does Mashvisor Gather Its Data From?
Mashvisor gathers its data from a number of different sources such as Airbnb API, Listhub, MLS, Rent Jungle, Redfin, in addition to other sources.
We gather all the data and “Mash” it together using our algorithms to determine the results and provide the user with the analytics to “Advise” them on their investment decisions.
Ready to close faster?
Start your 14-days-trial now and see Mashvisor in action!