Global tech giant Google announces its plans on expanding its operations and investing about $9.5 billion in the United States this year.
Tech Giant Google to Invest $9.5 Billion in the US in 2022
Google, one of the top and most recognizable tech companies in the world, has recently announced its plans of investing an additional $9.5 billion in the U.S. this year. That’s on top of its already existing hubs and centers in different parts of the country.
Its offices and data centers serve as vital anchors to local communities and help strengthen their economies. The presence of a physical Google office or center provides stable jobs to local folks.
Over the past five years, the tech company has already invested more than $35 billion in only 26 states. At a little over half of the total number of states in the country, the company has generated over 40,000 full-time employees. That’s not counting the over $40 billion it has invested in 2020 and 2021 in research and development within the US.
The additional budget is expected to create 12,000 more Google jobs and even more where local suppliers, partners, and communities are concerned.
Now some of you may be wondering that given the shift to remote work and more flexible working arrangements, why would Google invest in physical buildings at this point in time? Isn’t Google supposed to be run by geniuses? Isn’t it somewhat counterintuitive on the part of Google?
It isn’t. In fact, Google anticipates that investing in physical campuses will help stabilize the economies of communities they’re in with the jobs they create. The company’s presence creates a direct and indirect impact on the local economy. In 2021 alone, Google helped provide over $617 billion in economic activity across the country. Android apps created almost two million jobs while YouTube helped support 394,000 people (content creators and their partners) in the first year of the pandemic.
The good thing about all this development is that not only does it generate more jobs for people, but it also strengthens the digital tools that help individuals, entrepreneurs, and corporations thrive.
Related: Why the Best Cities for Tech Jobs Can Be the Top Cities to Invest in Real Estate
What Does This Mean for Real Estate Investors?
Google is looking at several different locations to bring their business to. These are just some of the ones on their list:
- Atlanta GA
- Douglasville GA
- Austin TX
- Midlothian TX
- Clarksville TN
- Reston VA
- Pryor OK
- Council Bluffs IA
- Papillion NE
- New York NY
- Pittsburgh PA
- Boulder CO
- San Jose CA
- Portland OR
- Kirkland WA
- Seattle WA
- Storey County NV
- Henderson NV
Once the global icon starts to roll out its plans, these locations are expected to blow up, especially things involving real estate. The number of jobs it will generate will increase in-migration in each location as Americans are still looking for better job opportunities today.
Real estate investors will do well to keep their radars on high alert and start scouting potential profitable investments. While Airbnb businesses may be doing well in the said locations (especially the bigger and more popular cities), traditional rental properties are the ones that show much promise at this time.
Smart investors will surely conduct due diligence on the said areas to see what the possible return on investment will be if they were to buy investment properties in those locations. Finding a potential income property, analyzing all the necessary data, calculating its profitability, and seeing how it will stack up against other rental comps is now easier with a website like Mashvisor.
Related: Looking for Reliable Traditional and Airbnb Rental Comps? Here’s the Best Source
Mashvisor is a real estate website that has helped thousands of investors make the best investment decisions. Its tools allow users to find the right rental properties and come up with the best rental strategies that yield the best cash on cash return rates. Its investment property calculator offers different features that make crunching numbers and locating the most ideal income-generating properties a lot faster and easier.
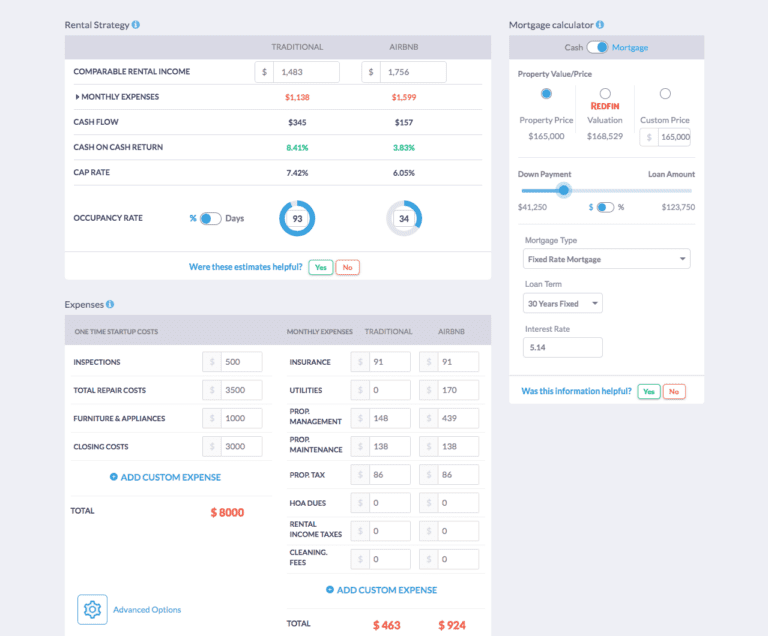
Mashvisor’s Investment Property Calculator can help you find a lucrative traditional rental property in one of Google’s office and data center locations.
Traditional Rental Market Data for Locations With Google Offices and Data Centers
We’ve enumerated some of the areas Google is investing in so we thought we’d take it a step further and give you Mashvisor’s latest traditional rental market data of the said locations. This is what those markets have to offer rental property investors if they choose to buy rental properties in some of those locations:
1. Douglasville, GA
- Median Property Price: $324,221
- Average Price per Square Foot: $177
- Days on Market: 64
- Number of Traditional Listings: 195
- Monthly Traditional Rental Income: $1,476
- Traditional Cash on Cash Return: 3.11%
- Traditional Cap Rate: 3.20%
- Price to Rent Ratio: 18 (medium)
- Walk Score: 74
2. Pryor, OK
- Median Property Price: $393,026
- Average Price per Square Foot: $175
- Days on Market: 55
- Number of Traditional Listings: 3
- Monthly Traditional Rental Income: $1,269
- Traditional Cash on Cash Return: 2.73%
- Traditional Cap Rate: 2.85%
- Price to Rent Ratio: 26 (high)
- Walk Score: 66
3. Atlanta GA
- Median Property Price: $601,992
- Average Price per Square Foot: $465
- Days on Market: 72
- Number of Traditional Listings: 3,799
- Monthly Traditional Rental Income: $2,425
- Traditional Cash on Cash Return: 2.53%
- Traditional Cap Rate: 2.59%
- Price to Rent Ratio: 21 (high)
- Walk Score: 44
4. Reston, VA
- Median Property Price: $561,015
- Average Price per Square Foot: $366
- Days on Market: 39
- Number of Traditional Listings: 682
- Monthly Traditional Rental Income: $2,132
- Traditional Cash on Cash Return: 2.32%
- Traditional Cap Rate: 2.37%
- Price to Rent Ratio: 22 (high)
- Walk Score: 86
5. Council Bluffs, IA
- Median Property Price: $331,690
- Average Price per Square Foot: $138
- Days on Market: 76
- Number of Traditional Listings: 6
- Monthly Traditional Rental Income: $1,328
- Traditional Cash on Cash Return: 2.30%
- Traditional Cap Rate: 2.41%
- Price to Rent Ratio: 21 (high)
- Walk Score: 7
6. Papillion, NE
- Median Property Price: $484,698
- Average Price per Square Foot: $206
- Days on Market: 129
- Number of Traditional Listings: 6
- Monthly Traditional Rental Income: $1,769
- Traditional Cash on Cash Return: 2.15%
- Traditional Cap Rate: 2.19%
- Price to Rent Ratio: 23 (high)
- Walk Score: 60
7. Pittsburgh, PA
- Median Property Price: $446,517
- Average Price per Square Foot: $110
- Days on Market: 80
- Number of Traditional Listings: 1,255
- Monthly Traditional Rental Income: $1,430
- Traditional Cash on Cash Return: 2.07%
- Traditional Cap Rate: 2.14%
- Price to Rent Ratio: 26 (high)
- Walk Score: 53
8. Clarksville, TN
- Median Property Price: $348,115
- Average Price per Square Foot: $175
- Days on Market: 70
- Number of Traditional Listings: 809
- Monthly Traditional Rental Income: $1,225
- Traditional Cash on Cash Return: 1.93%
- Traditional Cap Rate: 1.98%
- Price to Rent Ratio: 24 (high)
- Walk Score: 77
9. Kirkland, WA
- Median Property Price: $821,613
- Average Price per Square Foot: $518
- Days on Market: 41
- Number of Traditional Listings: 63
- Monthly Traditional Rental Income: $2,247
- Traditional Cash on Cash Return: 1.69%
- Traditional Cap Rate: 1.72%
- Price to Rent Ratio: 30 (high)
- Walk Score: 39
Related: Rental Housing Market Tracker for March 2023
10. Henderson, NV
- Median Property Price: $780,168
- Average Price per Square Foot: $317
- Days on Market: 50
- Number of Traditional Listings: 2,596
- Monthly Traditional Rental Income: $1,984
- Traditional Cash on Cash Return: 1.69%
- Traditional Cap Rate: 1.72%
- Price to Rent Ratio: 33 (high)
- Walk Score: 23
11. Midlothian, TX
- Median Property Price: $541,933
- Average Price per Square Foot: $207
- Days on Market: 79
- Number of Traditional Listings: 87
- Monthly Traditional Rental Income: $2,094
- Traditional Cash on Cash Return: 1.44%
- Traditional Cap Rate: 1.47%
- Price to Rent Ratio: 22 (high)
- Walk Score: 57
12. Portland, OR
- Median Property Price: $735,590
- Average Price per Square Foot: $520
- Days on Market: 54
- Number of Traditional Listings: 553
- Monthly Traditional Rental Income: $2,261
- Traditional Cash on Cash Return: 1.12%
- Traditional Cap Rate: 1.14%
- Price to Rent Ratio: 27 (high)
- Walk Score: 53
13. Reno, NV
- Median Property Price: $665,547
- Average Price per Square Foot: $390
- Days on Market: 54
- Number of Traditional Listings: 639
- Monthly Traditional Rental Income: $1,659
- Traditional Cash on Cash Return: 1.12%
- Traditional Cap Rate: 1.13%
- Price to Rent Ratio: 33 (high)
- Walk Score: 16
14. Seattle, WA
- Median Property Price: $1,402,453
- Average Price per Square Foot: $688
- Days on Market: 35
- Number of Traditional Listings: 1,546
- Monthly Traditional Rental Income: $2,738
- Traditional Cash on Cash Return: 0.93%
- Traditional Cap Rate: 0.94%
- Price to Rent Ratio: 43 (high)
- Walk Score: 64
15. New York, NY
- Median Property Price: $1,464,804
- Average Price per Square Foot: $1,577
- Days on Market: 141
- Number of Traditional Listings: 54,518
- Monthly Traditional Rental Income: $3,396
- Traditional Cash on Cash Return: 0.85%
- Traditional Cap Rate: 0.86%
- Price to Rent Ratio: 36 (high)
- Walk Score: 61
16. San Jose, CA
- Median Property Price: $1,467,036
- Average Price per Square Foot: $868
- Days on Market: 34
- Number of Traditional Listings: 509
- Monthly Traditional Rental Income: $3,143
- Traditional Cash on Cash Return: 0.80%
- Traditional Cap Rate: 0.81%
- Price to Rent Ratio: 39 (high)
- Walk Score: 48
17. Boulder, CO
- Median Property Price: $1,564,083
- Average Price per Square Foot: $705
- Days on Market: 47
- Number of Traditional Listings: 518
- Monthly Traditional Rental Income: $2,581
- Traditional Cash on Cash Return: 0.71%
- Traditional Cap Rate: 0.73%
- Price to Rent Ratio: 51 (high)
- Walk Score: 51
18. Austin, TX
- Median Property Price: $959,017
- Average Price per Square Foot: $544
- Days on Market: 57
- Number of Traditional Listings: 2,963
- Monthly Traditional Rental Income: $2,114
- Traditional Cash on Cash Return: 0.52%
- Traditional Cap Rate: 0.53%
- Price to Rent Ratio: 38 (high)
- Walk Score: 51
Related: Top 30 Locations for Traditional Cash on Cash Return in 2022
Wrapping Up
As Google continues to build offices and data centers globally and expand its operations, the communities they invest in get stronger economically from the number of created jobs to properties sold or rented out. Economic growth is definitely one of the factors that investors use to see whether a location is worth investing in or not.
In this case, the communities these Google offices and data centers are built will lure in rental property investors to buy income properties for sale to convert into long-term rentals. But before they make any decisions, it is still important for them to perform due diligence.
To get access to our real estate investment tools, click here to sign up for a 7-day free trial of Mashvisor today, followed by 15% off for life.