Irvine, California – CoreLogic’s Single Family Rent Index (SFRI), which analyzes data for single family rent price fluctuations in the US, was released in March.
Single Family Rental Rates Reach Record High Again in January 2022
According to the latest numbers, the year 2022 started strong for traditional rentals as single family rent prices continue to soar to record high levels. January logged a 12.6% year-over-year increase, a far cry from the 3.9% growth seen a year before.
CoreLogic’s latest SFRI release showed that all the metropolitan areas included in their coverage recorded significant year-over-year increases. Sun Belt cities, like Miami and Orlando, registered the largest year-over-year gains according to SFRI’s data. The year-over-year price growth more than tripled all gains from January 2021 and more than quadrupled from January 2020.
Related: Buying a Cash Flow Single Family Rental: 5 Steps
Supply vs Demand a Huge Factor in the Huge Spike in Rent Prices
One of the things real estate industry experts and insiders agree on is how supply and demand play an integral role in the continuing growth in single family rent price. It is no longer news that there is a shortage of housing inventory all over the US. Homebuyers and real estate investors are quite aware of that. They also know that the national shortage cannot keep up with the increasing demand as more folks are securing homes for themselves for both personal use and investment properties.
There’s also the small matter of inevitable home appreciation, which is generally expected for real estate investments. Only now, the increase was higher than normal, with a 19% increase in January 2022.
Let’s take for instance the Miami 2022 real estate market. According to real estate website Mashvisor, the median property value for a single-family home in sunny Miami back in January 2022 was $795,968. Just a couple of months later in March 2022, the median property price for Miami rose to a whopping $1,059,287.
The skyrocketing home prices are making it harder for the average American to own a home. It is one of the main reasons why the demand for traditional rental properties has increased over the past year.
And then, there are other factors outside the industry that are affecting the current market conditions, such as COVID-19, the Ukraine-Russia conflict, and their repercussions on the global economy.
According to CoreLogic’s principal economist, Molly Boesel, single family rent price growth reached a record-breaking 10-month streak in January. She also claims that the strong population growth is one of the drivers for the spike in rent prices, particularly in cities along the Sun Belt.
To better understand what the overall market looks like, CoreLogic broke it down into four different tiers. The national single family rent price growth and year-over-year increases are as follows:
- Lower (75% and below the regional median): 12%, a 3% increase compared to January 2021
- Lower Middle (75% to 100% of the regional median): 13.3%, a 3.2% increase compared to January 2021
- Higher Middle (100% to 125% of the regional median): 13.4%, a 3.6% increase compared to January 2021
- Higher (125% and above the regional median): 12.2%, a 4.5% increase compared to January 2021
Related: Mortgage Rates Watch April 2022: Mortgage Rates Hit Highest Since January 2019
Real Estate Investors Poised to Take Advantage of the Current Market Trend
Given the current property price and mortgage rate increases, owning a home has become more elusive to the average Joe. Many real estate investors beat them to affordable housing by offering all-cash purchases that ordinary folks can’t beat.
Investors are on the lookout for income properties for sale to offer as either traditional or vacation rental properties. They figure that they can help meet the demand for rental properties and hopefully offer temporary housing alternatives to people who cannot afford to buy a property at the moment.
For this reason, real estate investors are on high alert for properties that can help them offer affordable rental properties while making a decent return on investment. And while looking for the right property may seem like a lot of hard work, a website like Mashvisor can help make the property-hunting process quicker and more efficient.
Its large database covers countless investment properties in the 2022 US housing market. It also offers investors several real estate investing tools that make the search for property and analysis of market data a lot easier. Tools like the Property Finder, Real Estate Heatmap, and Investment Property Calculator can be easily accessed by Mashvisor subscribers to speed along the investment process without compromising the quality of research and data analysis needed to make wise investment decisions.
To get access to our real estate investment tools, click here to sign up for a 7-day free trial of Mashvisor today, followed by 15% off for life.
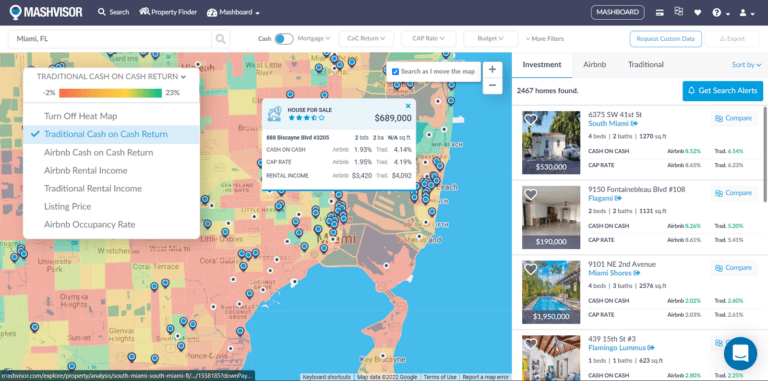
Mashvisor offers several tools, such the Real Estate Heatmap, that allow investors to speed up their investment process without compromising the quality of research and data analysis.
That being said, here are the top 20 metro areas the CoreLogic listed with the most impressive year-over-year gains on single family rent price. They are shown alongside Mashvisor’s up-to-date market data to give investors an idea of each location’s investment potential.
1. Miami, FL (38.6% year-over-year rent change, January 2022)
- Number of Traditional Listings: 11,271
- Monthly Traditional Rental Income: $3,745
- Traditional Cash on Cash Return: 1.87%
- Traditional Cap Rate: 1.91%
- Price to Rent Ratio: 24 (high)
- Number of Listings for Sale: 2,147
- Median Property Price: $1,059,287
- Average Price per Square Foot: $668
- Days on Market: 91
- Walk Score: 63
2. Orlando, FL (19.9% year-over-year rent change, January 2022)
- Number of Traditional Listings: 2,553
- Monthly Traditional Rental Income: $1,733
- Traditional Cash on Cash Return: 2.51%
- Traditional Cap Rate: 2.61%
- Price to Rent Ratio: 23 (high)
- Number of Listings for Sale: 295
- Median Property Price: $486,404
- Average Price per Square Foot: $282
- Days on Market: 65
- Walk Score: 40
3. Phoenix, AZ (18.9% year-over-year rent change, January 2022)
- Number of Traditional Listings: 5,580
- Monthly Traditional Rental Income: $2,152
- Traditional Cash on Cash Return: 2.04%
- Traditional Cap Rate: 2.08%
- Price to Rent Ratio: 27
- Number of Listings for Sale: 923
- Median Property Price: $688,679
- Average Price per Square Foot: $356
- Days on Market: 21
- Walk Score: 28
4. Las Vegas, NV (16.6% year-over-year rent change, January 2022)
- Number of Traditional Listings: 10,579
- Monthly Traditional Rental Income: $1,602
- Traditional Cash on Cash Return: 1.12%
- Traditional Cap Rate: 1.15%
- Price to Rent Ratio: 33 (high)
- Number of Listings for Sale: 2,128
- Median Property Price: $625,200
- Average Price per Square Foot: $435
- Days on Market: 73
- Walk Score: 36
5. San Diego, CA (15.9% year-over-year rent change, January 2022)
- Number of Traditional Listings: 3,441
- Monthly Traditional Rental Income: $3,167
- Traditional Cash on Cash Return: 1.16%
- Traditional Cap Rate: 1.18%
- Price to Rent Ratio: 34 (high)
- Number of Listings for Sale: 857
- Median Property Price: $1,300,412
- Average Price per Square Foot: $813
- Days on Market: 54
- Walk Score: 52
6. Austin, TX (15.3% year-over-year rent change, January 2022)
- Number of Traditional Listings: 2,963
- Monthly Traditional Rental Income: $2,114
- Traditional Cash on Cash Return: 0.52%
- Traditional Cap Rate: 0.53%
- Price to Rent Ratio: 38
- Number of Listings for Sale: 306
- Median Property Price: $959,017
- Average Price per Square Foot: $544
- Days on Market: 57
- Walk Score: 51
7. Boston, MA (13.7% year-over-year rent change, January 2022)
- Number of Traditional Listings: 5,675
- Monthly Traditional Rental Income: $2,938
- Traditional Cash on Cash Return: 0.81%
- Traditional Cap Rate: 0.83%
- Price to Rent Ratio: 33 (high)
- Number of Listings for Sale: 54
- Median Property Price: $1,155,675
- Average Price per Square Foot: $1,025
- Days on Market: 70
- Walk Score: 85
8. Dallas, TX (13.4% year-over-year rent change, January 2022)
- Number of Traditional Listings: 6,975
- Monthly Traditional Rental Income: $2,362
- Traditional Cash on Cash Return: 1.28%
- Traditional Cap Rate: 1.31%
- Price to Rent Ratio: 24 (high)
- Number of Listings for Sale: 1,424
- Median Property Price: $673,776
- Average Price per Square Foot: $330
- Days on Market: 120
- Walk Score: 46
9. Atlanta, GA (12.8% year-over-year rent change, January 2022)
- Number of Traditional Listings: 3,799
- Monthly Traditional Rental Income: $2,425
- Traditional Cash on Cash Return: 2.53%
- Traditional Cap Rate: 2.59%
- Price to Rent Ratio: 21 (high)
- Number of Listings for Sale: 2,626
- Median Property Price: $601,992
- Average Price per Square Foot: $465
- Days on Market: 72
- Walk Score: 44
10. Tucson, AZ (12.1% year-over-year rent change, January 2022)
- Number of Traditional Listings: 2,370
- Monthly Traditional Rental Income: $1,339
- Traditional Cash on Cash Return: 1.99%
- Traditional Cap Rate: 2.05%
- Price to Rent Ratio: 27 (high)
- Number of Listings for Sale: 737
- Median Property Price: $432,447
- Average Price per Square Foot: $251
- Days on Market: 53
- Walk Score: 40
11. Charlotte, NC (11.5% year-over-year rent change, January 2022)
- Number of Traditional Listings: 2,796
- Monthly Traditional Rental Income: $2,090
- Traditional Cash on Cash Return: 1.74%
- Traditional Cap Rate: 1.78%
- Price to Rent Ratio: 25 (high)
- Number of Listings for Sale: 1,051
- Median Property Price: $626,525
- Average Price per Square Foot: $335
- Days on Market: 84
- Walk Score: 36
12. Houston, TX (10.0% year-over-year rent change, January 2022)
- Number of Traditional Listings: 4,393
- Monthly Traditional Rental Income: $2,163
- Traditional Cash on Cash Return: 1.74%
- Traditional Cap Rate: 1.78%
- Price to Rent Ratio: 23 (high)
- Number of Listings for Sale: 723
- Median Property Price: $594,341
- Average Price per Square Foot: $258
- Days on Market: 14
- Walk Score: 44
13. Los Angeles, CA (9.2% year-over-year rent change, January 2022)
- Number of Traditional Listings: 15,142
- Monthly Traditional Rental Income: $4,422
- Traditional Cash on Cash Return: 1.49%
- Traditional Cap Rate: 1.50%
- Price to Rent Ratio: 28 (high)
- Number of Listings for Sale: 2,506
- Median Property Price: $1,491,827
- Average Price per Square Foot: $1,086
- Days on Market: 68
- Walk Score: 55
14. Seattle, WA (9.0% year-over-year rent change, January 2022)
- Number of Traditional Listings: 1,546
- Monthly Traditional Rental Income: $2,738
- Traditional Cash on Cash Return: 0.93%
- Traditional Cap Rate: 0.94%
- Price to Rent Ratio: 43 (high)
- Number of Listings for Sale: 395
- Median Property Price: $1,402,453
- Average Price per Square Foot: $688
- Days on Market: 35
- Walk Score: 64
15. Chicago, IL (8.8% year-over-year rent change, January 2022)
- Number of Traditional Listings: 29,196
- Monthly Traditional Rental Income: $2,375
- Traditional Cash on Cash Return: 1.00%
- Traditional Cap Rate: 1.04%
- Price to Rent Ratio: 20 (high)
- Number of Listings for Sale: 3,914
- Median Property Price: $576,887
- Average Price per Square Foot: $359
- Days on Market: 48
- Walk Score: 65
16. Honolulu, HI (8.7% year-over-year rent change, January 2022)
- Number of Traditional Listings: 3,683
- Monthly Traditional Rental Income: $2,090
- Traditional Cash on Cash Return: 2.26%
- Traditional Cap Rate: 2.30%
- Price to Rent Ratio: 31 (high)
- Number of Listings for Sale: 638
- Median Property Price: $784,575
- Average Price per Square Foot: $885
- Days on Market: 86
- Walk Score: 49
17. Philadelphia, PA (8.1% year-over-year rent change, January 2022)
- Number of Traditional Listings: 12,142
- Monthly Traditional Rental Income: $1,838
- Traditional Cash on Cash Return: 2.44%
- Traditional Cap Rate: 2.53%
- Price to Rent Ratio: 29 (high)
- Number of Listings for Sale: 1,858
- Median Property Price: $640,459
- Average Price per Square Foot: $406
- Days on Market: 97
- Walk Score: 64
18. New York, NY (6.5% year-over-year rent change, January 2022)
- Number of Traditional Listings: 54,518
- Monthly Traditional Rental Income: $3,396
- Traditional Cash on Cash Return: 0.85%
- Traditional Cap Rate: 0.86%
- Price to Rent Ratio: 36 (high)
- Number of Listings for Sale: 6,596
- Median Property Price: $1,464,804
- Average Price per Square Foot: $1,577
- Days on Market: 141
- Walk Score: 61
19. St. Louis, MO (6.0% year-over-year rent change, January 2022)
- Number of Traditional Listings: 1,264
- Monthly Traditional Rental Income: $1,290
- Traditional Cash on Cash Return: 1.28%
- Traditional Cap Rate: 1.33%
- Price to Rent Ratio: 24 (high)
- Number of Listings for Sale: 707
- Median Property Price: $371,171
- Average Price per Square Foot: $185
- Days on Market: 72
- Walk Score: 57
20. Washington, DC (5.6% year-over-year rent change, January 2022)
- Number of Traditional Listings: 4,639
- Monthly Traditional Rental Income: $2,489
- Traditional Cash on Cash Return: 1.66%
- Traditional Cap Rate: 1.69%
- Price to Rent Ratio: 26 (high)
- Number of Listings for Sale: 1,596
- Median Property Price: $771,880
- Average Price per Square Foot: $632
- Days on Market: 99
- Walk Score: 62
Related: The Top 10 Fastest Growing Rental Markets in the US 2022
Wrapping Up
The upward trend in the single family rent price growth may or may not slow down over the next few months. It will greatly depend on how the market as a whole can recover from the lack of housing inventory and the global inflation. The next CoreLogic SFRI will be released later in April with data from February 2022. Until then, we can only hope for prices to slow down so that affordable housing is within reach for the average American.