DEADWOOD Investment Analysis
Investment Property in DEADWOOD, OR

DEADWOOD, OR Real Estate Investment Performance
$ 165,000
Median
1,321
Avg/Sq.ft.
7.00%
Traditional
N/A
Airbnb
$ 3,591
Traditional
N/A
Airbnb
$ 3,591
Traditional
N/A
Airbnb
92
Investment
5
Airbnb
N/A
Traditional
13%
Airbnb occupancy rate
DEADWOOD, OR Properties Rental Prices
| RENTAL STRATEGY | 1 ROOM | 2 ROOMS | 3 ROOMS | 4 ROOMS |
|---|---|---|---|---|
| Airbnb | N/A | N/A | N/A | N/A |
| Traditional | $ 1,117 | $ 1,468 | $ 2,043 | $ 2,468 |
| 1 ROOM | N/A |
|---|---|
| 2 ROOMS | N/A |
| 3 ROOMS | N/A |
| 4 ROOMS | N/A |
| 1 ROOM | $ 1,117 |
|---|---|
| 2 ROOMS | $ 1,468 |
| 3 ROOMS | $ 2,043 |
| 4 ROOMS | $ 2,468 |
Predict Short-Term Rental Revenue
Want to host your STR property on Airbnb?
Our Airbnb calculator is a free tool to calculate how much can you make on Airbnb.
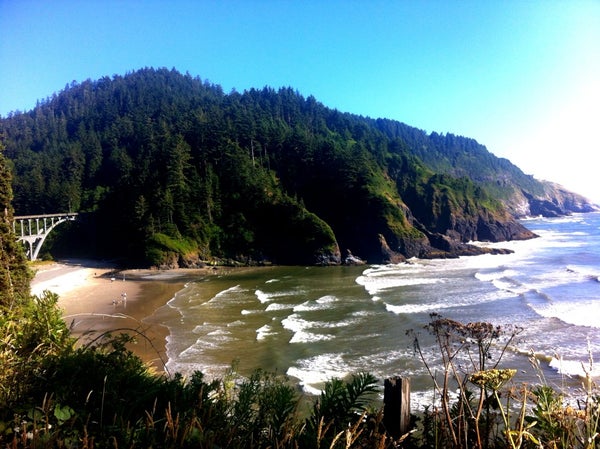
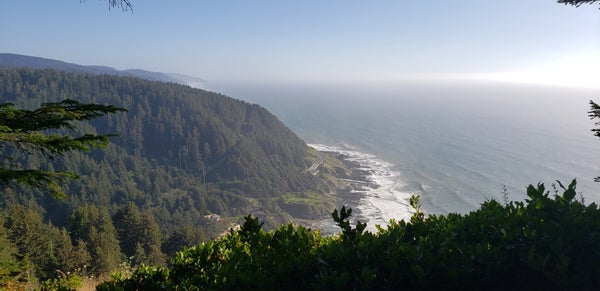
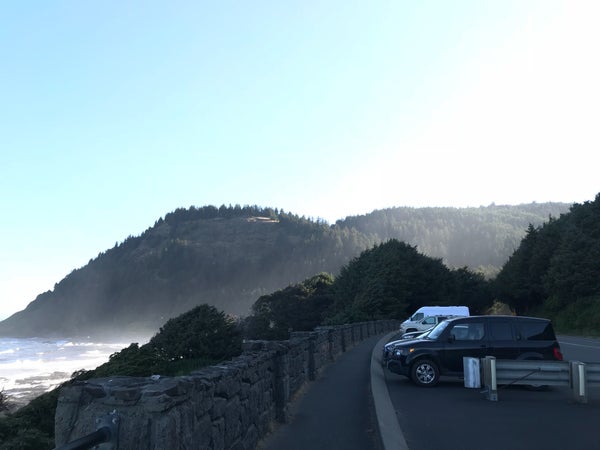
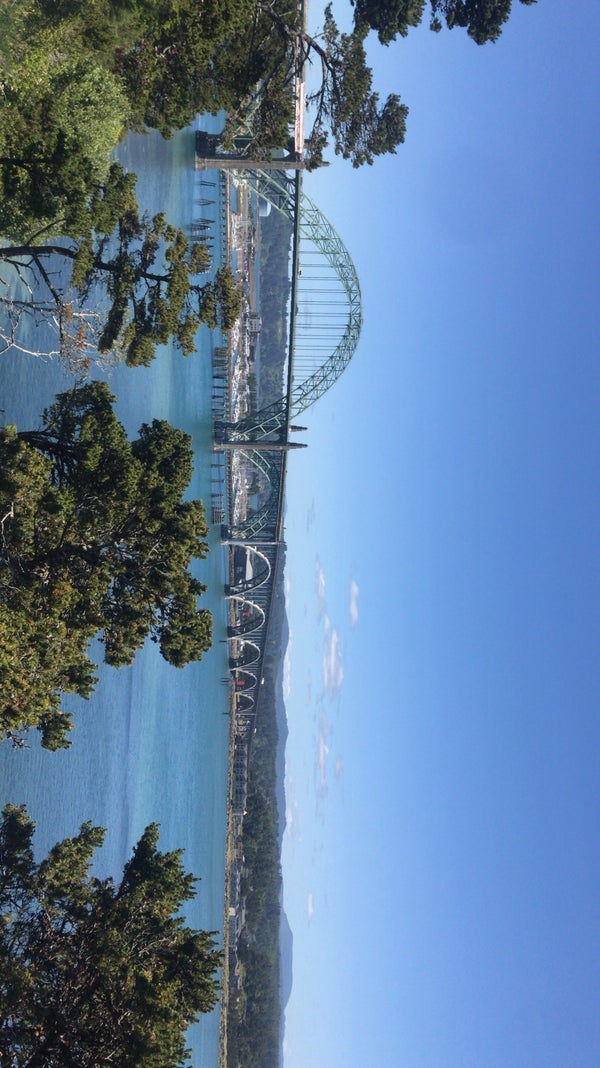
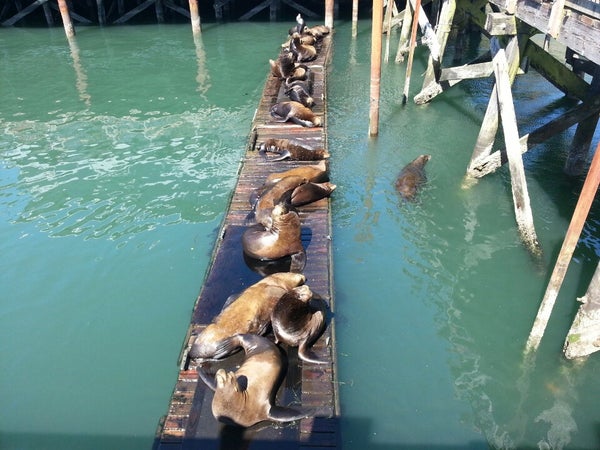
Top DEADWOOD, OR Attractions and Activities
-
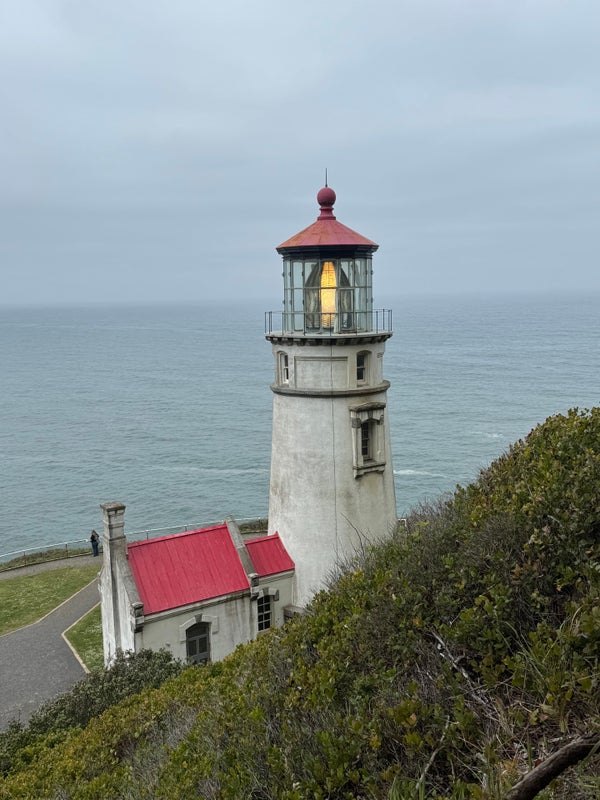 Lighthouse
 -
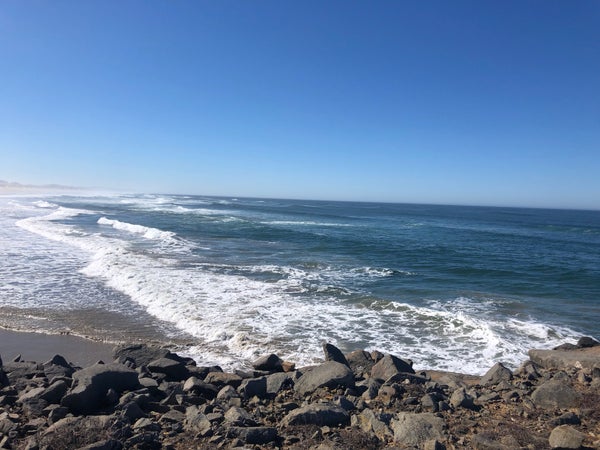
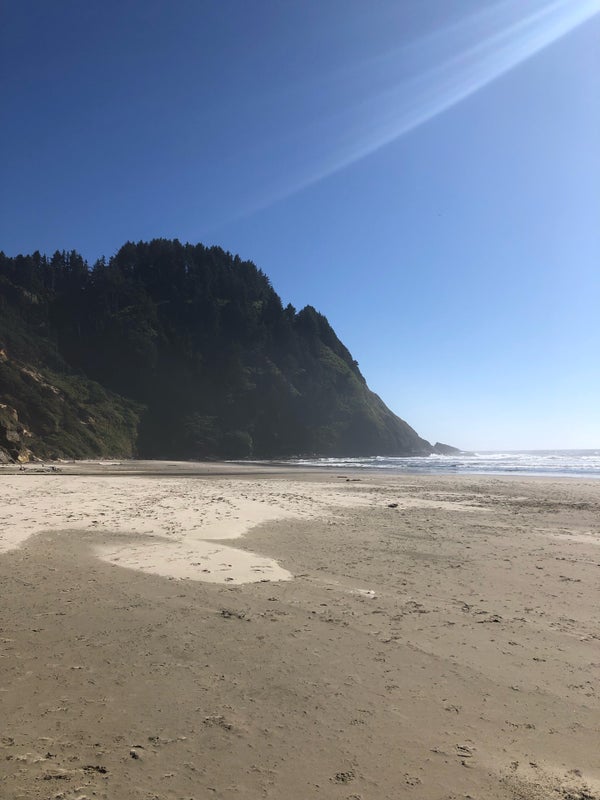 Beach
Beach -
Heceta Beach
7.7
Beach -
 Beach
Beach -
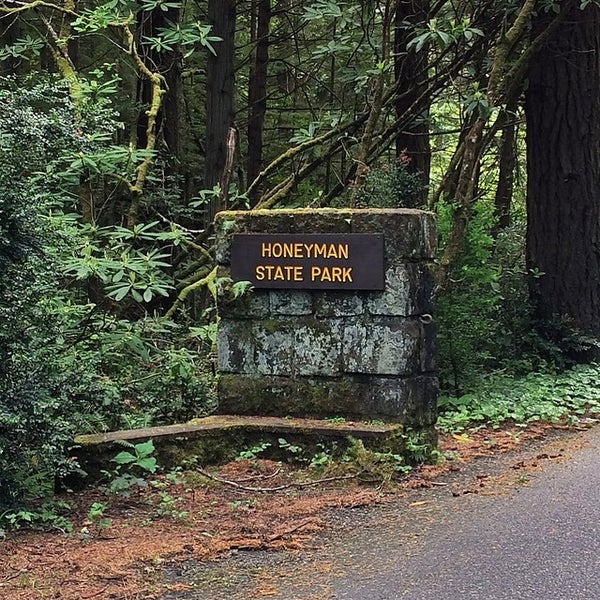 State or Provincial Park
 -
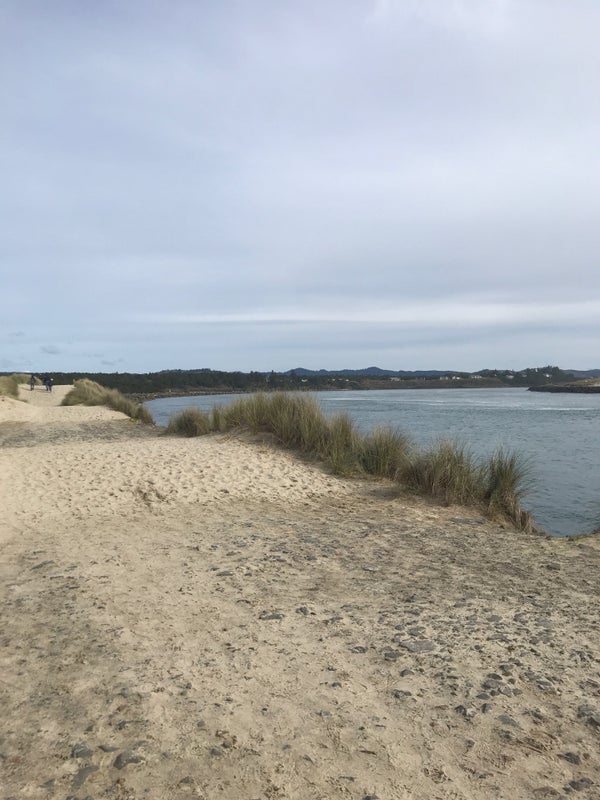
North Jetty
7.7
Beach -
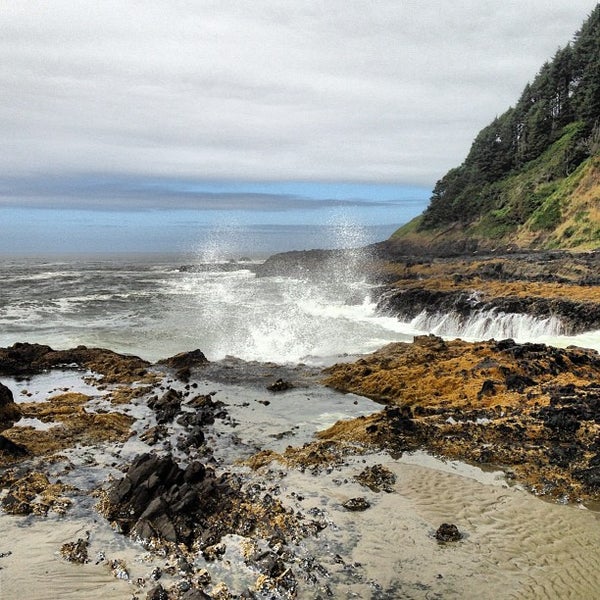
Devil's Churn
9.1
Scenic Lookout -
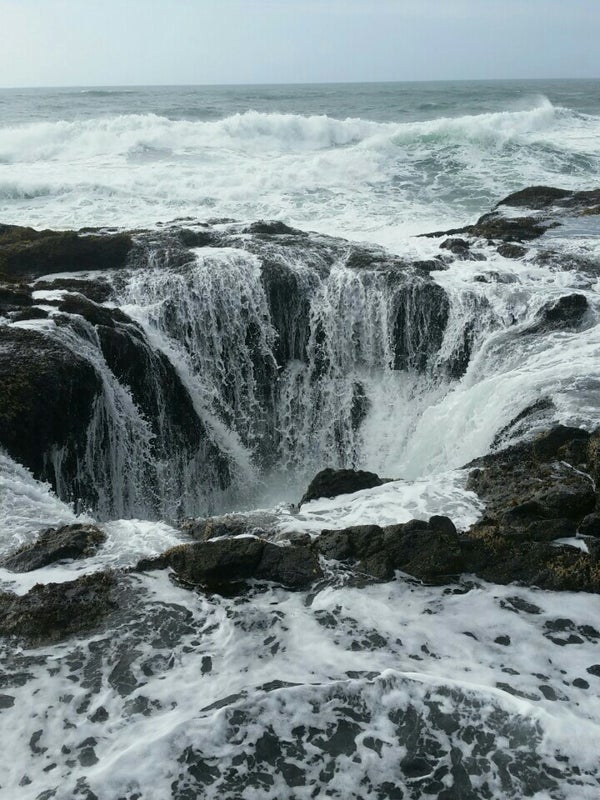
Thor's Well
8.7
Scenic Lookout -
 Beach
Beach -
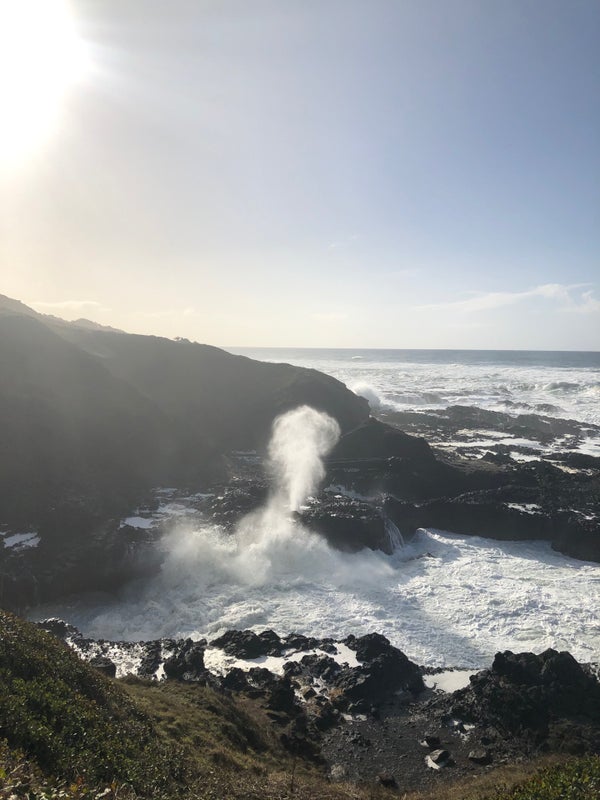
Spouting Horn
8.1
Beach -
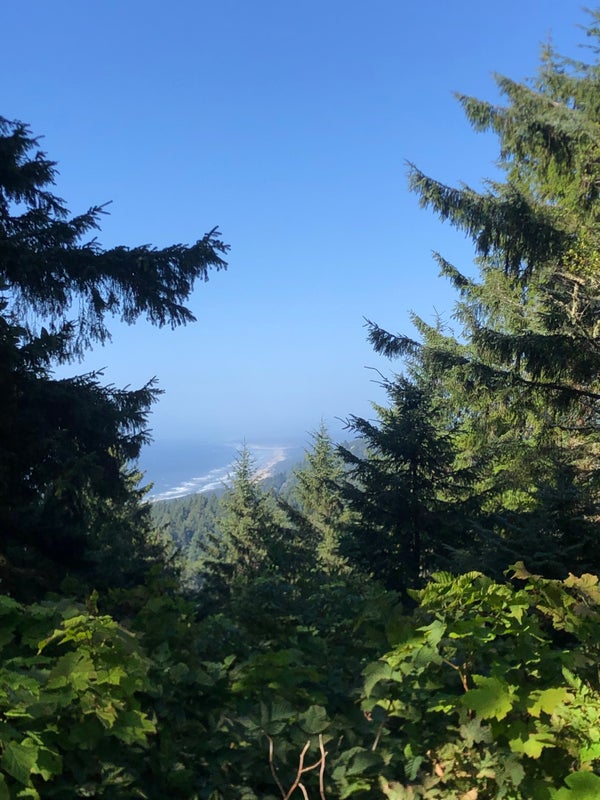
Cape Perpetua
8.1
Scenic Lookout -
Cook's Chasm
7.7
Scenic Lookout -
South Jetty
7.1
Beach -
 Lighthouse
 -
Newport Bayfront
8.1
Waterfront -
 Museum


![%=topPerformingBlogs[i].title%>](https://images.mashvisor.com/40X40/C/https://www.mashvisor.com/blog/wp-content/uploads/2025/09/Copilot_20250901_142238-585x390.png)
![%=topPerformingBlogs[i].title%>](https://images.mashvisor.com/40X40/C/https://www.mashvisor.com/blog/wp-content/uploads/2022/02/How-to-Find-Out-the-Airbnb-Demand-in-My-Area-585x390.jpg)
![%=topPerformingBlogs[i].title%>](https://images.mashvisor.com/40X40/C/https://www.mashvisor.com/blog/wp-content/uploads/2025/04/best-short-term-rental-markets-2025-585x390.jpg)
![%=topPerformingBlogs[i].title%>](https://images.mashvisor.com/40X40/C/https://www.mashvisor.com/blog/wp-content/uploads/2019/12/The-Most-Profitable-Types-of-Real-Estate-Investment-for-2020-585x390.jpg)
![%=topPerformingBlogs[i].title%>](https://images.mashvisor.com/40X40/C/https://www.mashvisor.com/blog/wp-content/uploads/2023/08/best-airbnb-locations-585x390.jpg)


