Data Methodology & Resources
Valuable data for valuable investments. This is how we do it
Where does Mashvisor get its data from?
These are our main data sources for investment properties (properties that can be purchased), traditional and Airbnb rental comps.
Over
+6m
investment properties from
Over
+2m
Traditional comp rental properties from

Over
+2m
Airbnb comp rental properties from
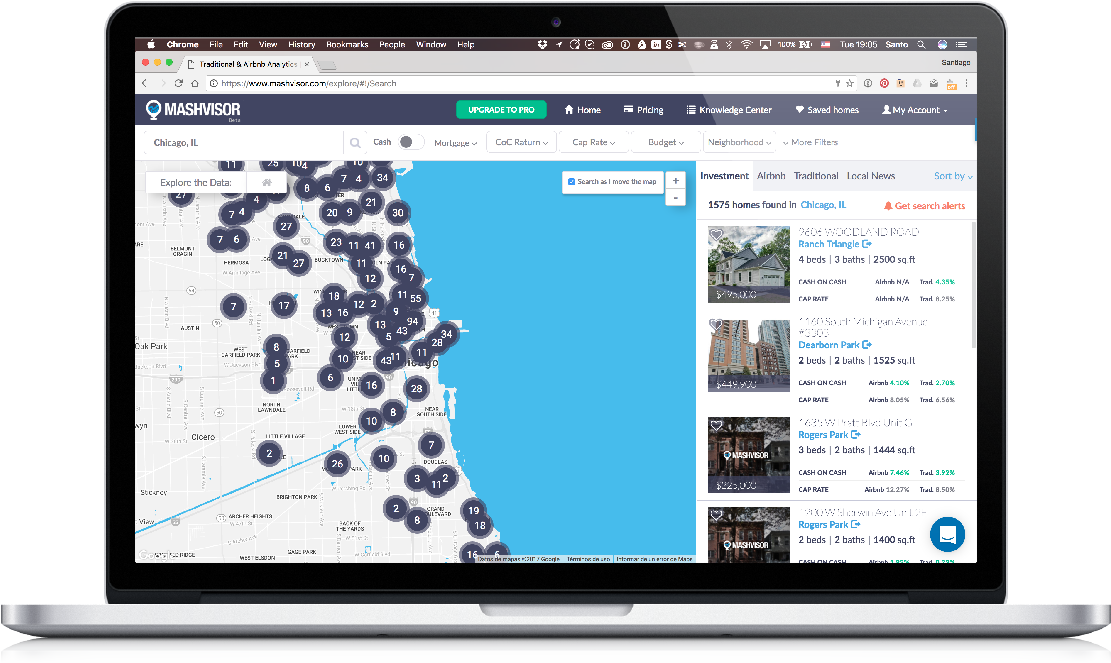
What kind of data does Mashvisor provide?
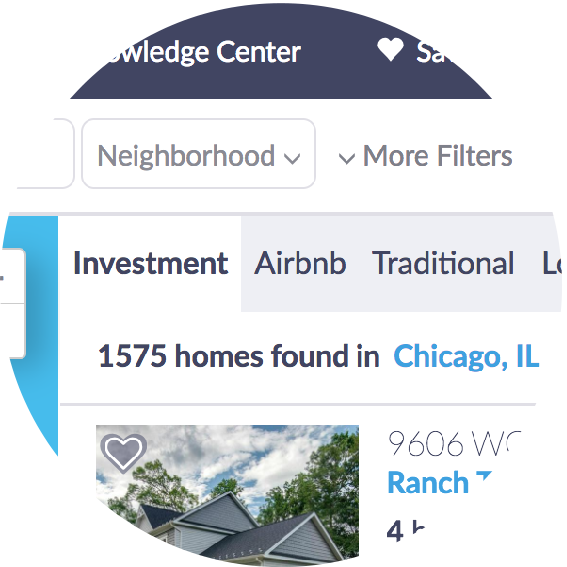
There are three tabs when looking for properties.
-
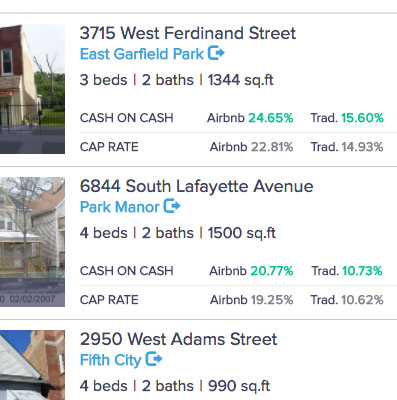
The Investment properties
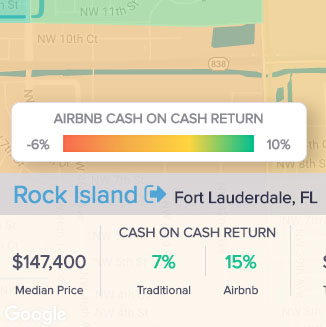
The investment properties tab will give you a list of the properties that are available for purchase, as well as their projected returns. When hovering over a property on the map or selecting it from the list of properties, Mashvisor will provide data related to the potential cash on cash return and cap rate of the property if it was rented out traditionally or through Airbnb, allowing investors to determine the strategy that is more suitable for their investment.
-
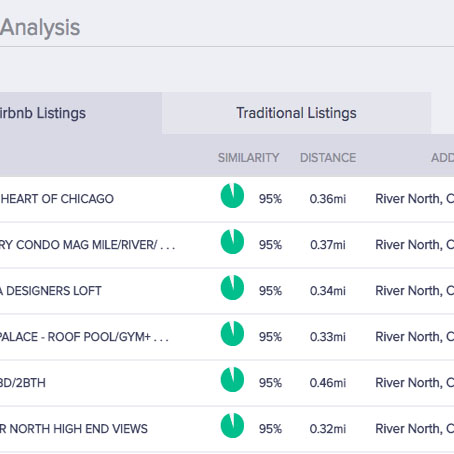
The Traditional and Airbnb tabs are rental comps
This option allows the investor to see all existing traditional and rental properties and Airbnb listings in the area, which can then be used in order to understand how the different properties are performing by comparing them to one another. Just like any other rental website, the monthly rent for traditional rental properties will be displayed. Airbnb properties will also display their nightly rates, estimated monthly rental income, as well as their Airbnb occupancy rate.
What does Mashvisor do with the data and how?
What do I gain from it?
Mashvisor uses comparative and predictive data to get its projections of these properties. We filter the properties from these sources based on our criteria: the property must be a(n) apartment, condo, townhouse, or single-family house with a minimum of 1 bedroom and maximum of 4 bedrooms.
After selecting the properties, we calculate the rental rates of different areas based on the rental income to bedroom ratio from traditional rentals and Airbnb listings.
For the Airbnb occupancy rate, we check the number of bookings on a monthly basis, while the Airbnb occupancy rate displayed on the platform is based on the number of bookings that took place in the past 10 months. From there, we are then able to project the Airbnb occupancy rates for other properties based on the property’s rental rate and the property type. Finally, the estimated Airbnb rental income is calculated by multiplying the rental rate by the occupancy rate.
After calculating the values for individual properties, the averages are used to calculate the average for the entire neighborhood. Metrics such as cash on cash return and cap rate are then calculated by plugging their projections into the formulas.
What are the key outcomes of the data that can be used by the user?
 Understand a neighborhood’s average investment performance right away.
 Easily access and understand rental comps.
 Find a property quickly with the returns already calculated.
How accurate is Mashvisor?
- Mashvisor gathers data from reliable and reputable sources.
- Data on the platform is updated once per month while MLS listings are updated daily.
- In addition, the results of our algorithms are regularly tested to make sure the projections still make sense.
Your search for rental properties begins and ends here
Use analytics to find lucrative traditional or Airbnb properties in a matter of minutes.
No more driving around, no more spreadsheets.