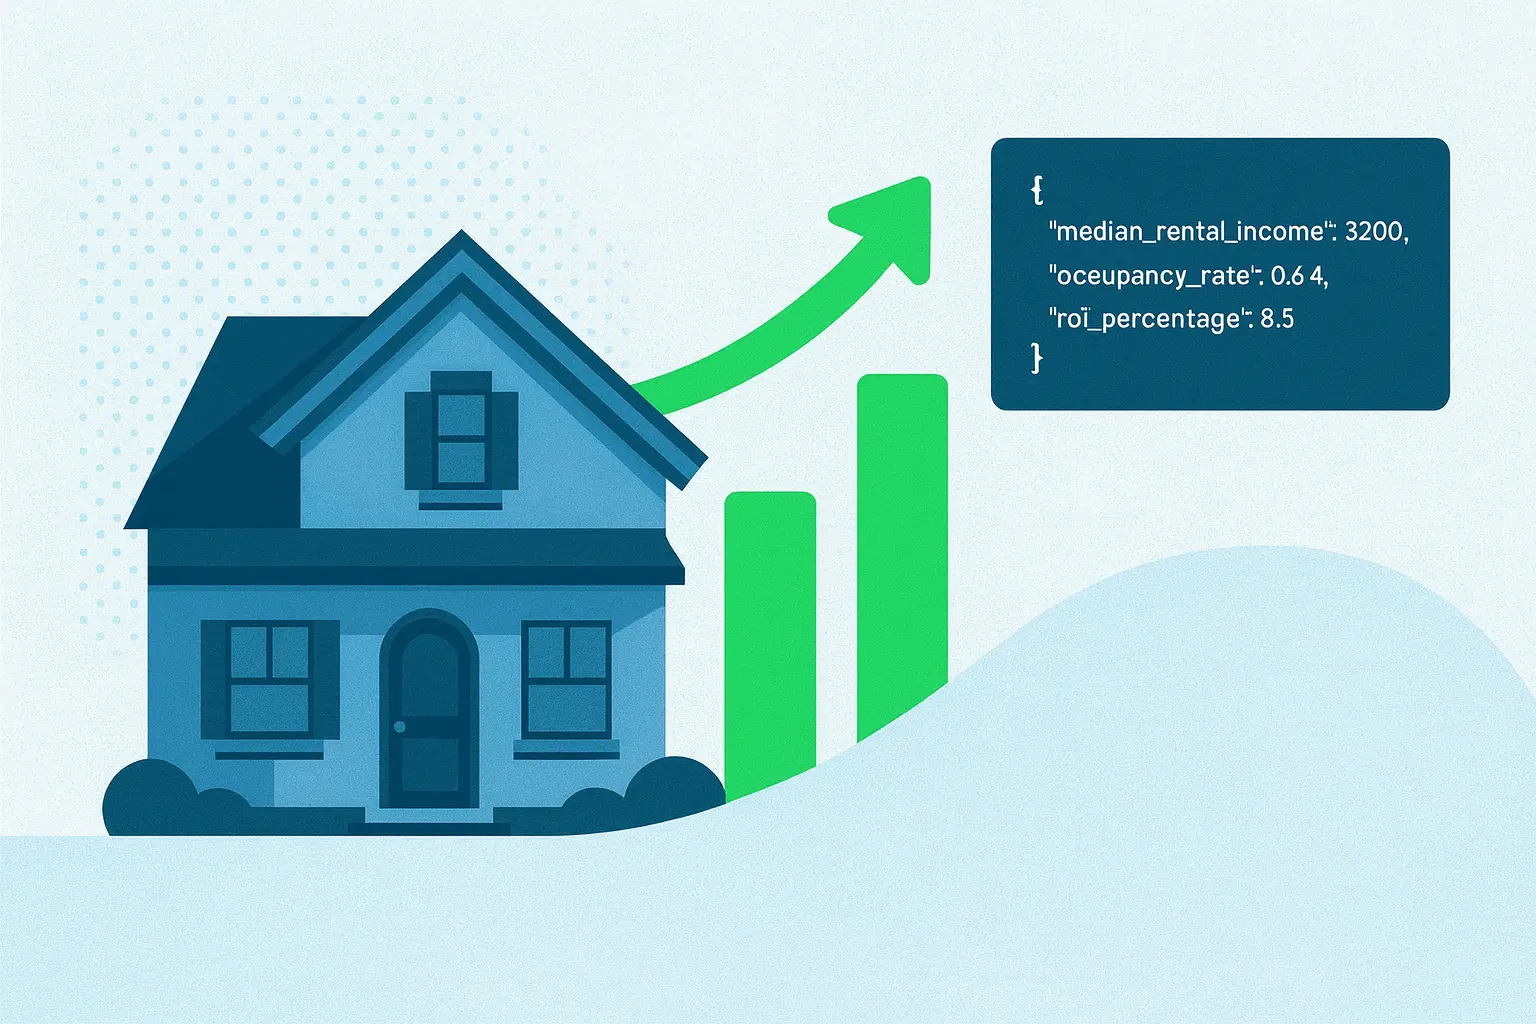
The Mashvisor Lookup API solves the biggest pain in Airbnb revenue modeling: dirty rental data, unreliable scrapers, and inconsistent revenue calculations. As a real estate data API, it returns complete, pre-modeled financial metrics in a single call. No scraping, no manual calculations, no custom data cleaning. Developers can build a full revenue model quickly using this production-ready rental data API.
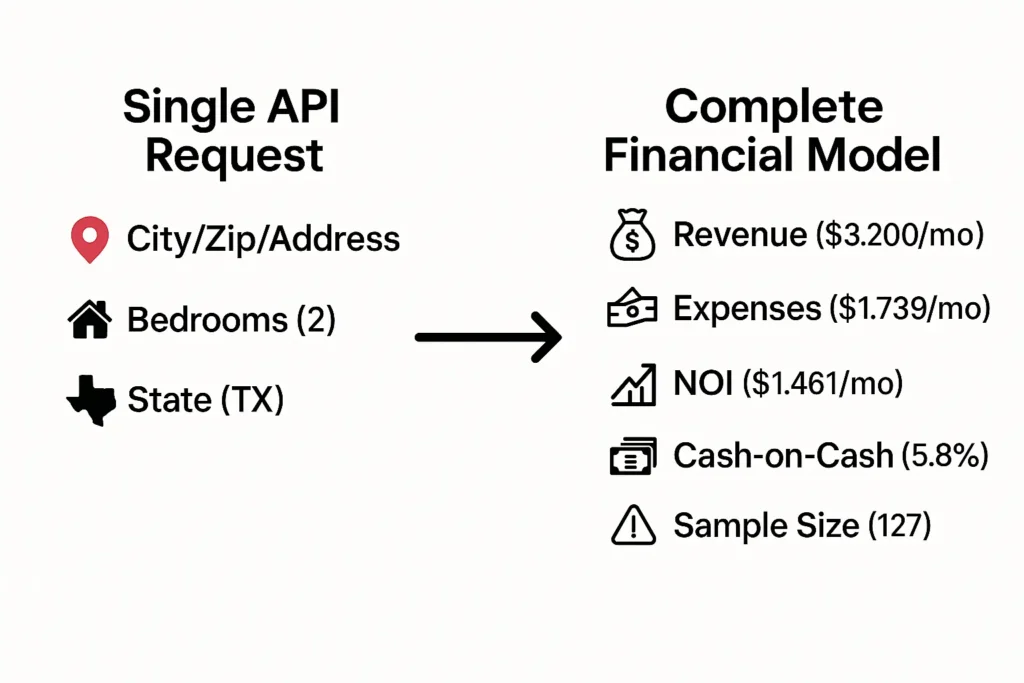
For example, a developer building an investor dashboard can fetch monthly revenue, occupancy, and expenses for any U.S. market with a single request—no scraping or manual modeling required. This makes Lookup one of the most efficient property data APIs available to PropTech teams.
This guide walks you through turning a single Lookup API response into a complete Airbnb revenue model.
Why Lookup is the core engine:
- Returns revenue, occupancy, expenses, cash flow, cap rate, and cash-on-cash metrics
- Works at city, zip, and address levels nationwide
- Pre-modeled metrics reduce complexity and development time
Prerequisites:
- Mashvisor API key (request access at https://www.mashvisor.com/data-api)
- Basic Python knowledge
- Understanding of rental property data
API Coverage: United States (all 50 states) and international markets including Great Britain (GB), Canada (CA), Spain (ES), Australia (AU), United Arab Emirates (AE), France (FR), South Africa (ZA), Saudi Arabia (SA), Greece (GR).
Summary
Mashvisor’s Lookup API provides a complete, production-grade data pipeline for Airbnb underwriting. A single request returns pre-modeled revenue, occupancy, ADR, RevPAR, expenses, NOI, cash flow, and cash-on-cash return, along with sample-size and data-quality indicators.
This guide shows how to transform the Lookup response into a full revenue model, apply financing logic, implement statistical fallbacks across address/zip/city levels, and output investment-ready summaries suitable for PropTech applications, valuation engines, and automated underwriting workflows.
II. How the Lookup API Works
A. Minimal API Request
Example:
| import requests API_KEY = ‘your_api_key’ BASE_URL = ‘https://api.mashvisor.com/v1.1/client/rento-calculator/lookup’ def get_market_data(params, api_key=None): “””Fetch Airbnb market data from Mashvisor API.””” headers = {‘x-api-key’: api_key or API_KEY} response = requests.get(BASE_URL, params=params, headers=headers) response.raise_for_status() return response.json() |
B. Supported Parameters
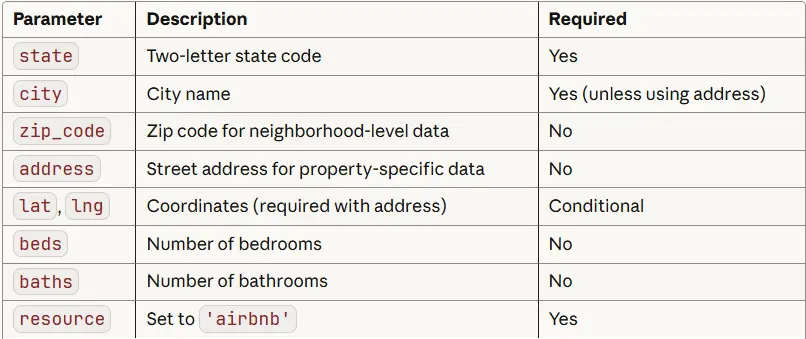
Analysis levels:
- City-level: Best for market screening — use when sample_size ≥ 80 for top confidence.
- Zip-level: Best for neighborhood analysis — require sample_size ≥ 30.
- Address-level: Best for specific property evaluation — require sample_size ≥ 15 (requires lat/lng).
With the request structure established, the next step is understanding the shape of the response. Every part of the revenue model is derived directly from this JSON structure.
C. How Often Is the Historical Dataset Refreshed?
Mashvisor’s underlying dataset is updated every day to keep the metrics as accurate as possible. Each refresh incorporates the latest shifts in occupancy trends, pricing movements, and short-term rental supply across major STR platforms. These updated values flow directly into the API, so developers automatically receive the newest figures without needing to take any extra steps.
Read more: How to Use the Historical Performance API
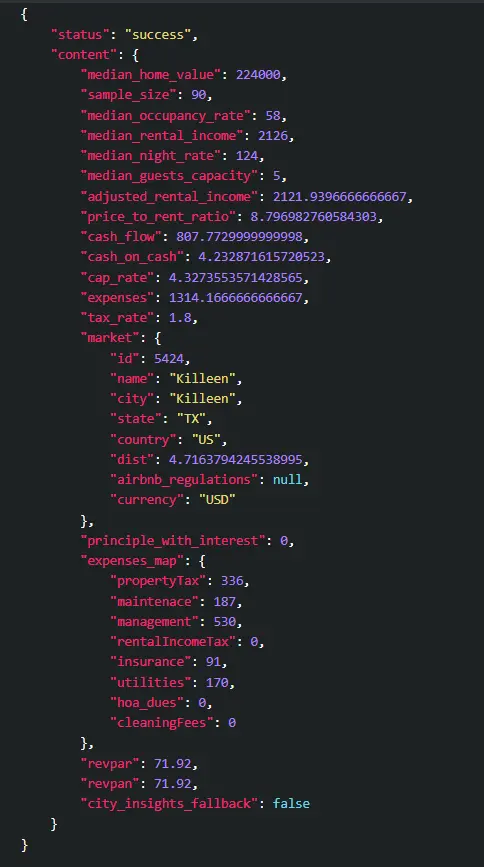
III. Understanding the Lookup Response
The Lookup API returns a structured JSON object containing aggregated Airbnb metrics for the requested location. Each entry inside content represents a subgroup of comparable properties (for example, by bedroom/bath configuration), along with median revenue, occupancy, and sample size. Below is a trimmed preview of the JSON structure returned by the endpoint:
IV. How to Build the Airbnb Revenue Model
A. Model Structure
The Airbnb revenue model consists of five core components:
- Property & market context — Location, value, market ID
- Revenue metrics — Income, occupancy, nightly rates
- Expense metrics — Itemized operating costs
- Profitability metrics — NOI, cash flow, returns
- Metadata — Sample size, data quality indicators
B. Main Code: build_revenue_model()
The revenue model is constructed from five layers: property data, revenue metrics, expenses, profitability, and metadata. Before diving into the full implementation, here is the structural overview so you can understand the shape of the function. The complete production-ready function follows immediately afterward.
| # Core structure (full function below) def build_revenue_model(api_response, financing_params=None): content = api_response[‘content’] model = { ‘property’: {…}, # location, market_id, median_value ‘revenue’: {…}, # monthly/annual income, nightly rate, occupancy ‘expenses’: {…}, # itemized operating costs ‘profitability’: {…}, # NOI, cap rate, cash flow placeholders ‘metadata’: {…} # sample_size, data_quality, analysis_date } # Financing logic and recalculations appear in the full implementation below return model |
Full Implementation
The full production-ready implementation contains all field mappings, fallback handling, defensive checks, and optional financing logic used in real integrations.
| from datetime import datetime def build_revenue_model(api_response, financing_params=None): “”” Build complete revenue model from Mashvisor lookup API data. Args: api_response: JSON response from Mashvisor /rento-calculator/lookup financing_params: Optional dict with down_payment_pct, interest_rate, loan_term Returns: Complete revenue model dict “”” if api_response.get(‘status’) != ‘success’: raise ValueError(“API request failed”) content = api_response[‘content’] market = content[‘market’] expenses_map = content[‘expenses_map’] maintenance = ( expenses_map.get(‘maintenance’) or expenses_map.get(‘maintenace’) or 0 ) # —————————————– # NEW: data quality threshold mapping (minimal version) # —————————————– _s = content.get(‘sample_size’) if _s is None: dq = ‘unknown’ elif _s >= 80: dq = ‘high’ elif _s >= 30: dq = ‘medium’ elif _s >= 15: dq = ‘low’ else: dq = ‘very_low’ # —————————————– # 1. Property & Location Data model = { ‘property’: { ‘location’: f”{market[‘city’]}, {market[‘state’]}“, ‘market_id’: market[‘id’], ‘median_value’: content[‘median_home_value’], }, # 2. Revenue Projections ‘revenue’: { ‘monthly_income’: content[‘median_rental_income’], ‘annual_income’: content[‘median_rental_income’] * 12, ‘nightly_rate’: content[‘median_night_rate’], ‘occupancy_rate’: content[‘median_occupancy_rate’], ‘revpar’: content[‘revpar’], ‘guest_capacity’: content[‘median_guests_capacity’], }, # 3. Expense Breakdown (all fields documented in expenses_map) ‘expenses’: { ‘monthly_total’: content[‘expenses’], ‘annual_total’: content[‘expenses’] * 12, ‘property_tax’: expenses_map[‘propertyTax’], ‘maintenance’: maintenance, ‘management’: expenses_map[‘management’], ‘rental_income_tax’: expenses_map[‘rentalIncomeTax’], ‘insurance’: expenses_map[‘insurance’], ‘utilities’: expenses_map[‘utilities’], ‘hoa_dues’: expenses_map[‘hoa_dues’], ‘cleaning’: expenses_map[‘cleaningFees’], }, # 4. Pre-Financing Profitability ‘profitability’: { ‘monthly_noi’: content[‘median_rental_income’] – content[‘expenses’], ‘annual_noi’: (content[‘median_rental_income’] – content[‘expenses’]) * 12, ‘cap_rate’: content[‘cap_rate’], ‘cash_flow_api’: content[‘cash_flow’], # from API ‘cash_on_cash_api’: content[‘cash_on_cash’], # from API }, # 5. Data Quality Indicators ‘metadata’: { ‘sample_size’: content.get(‘sample_size’), ‘data_quality’: dq, # <– replaced old good/moderate/low ternary ‘analysis_date’: datetime.now().isoformat(), ‘price_to_rent_ratio’: content.get(‘price_to_rent_ratio’), ‘regulations’: market.get(‘airbnb_regulations’), ‘city_insights_fallback’: content.get(‘city_insights_fallback’), } } # 6. Add Financing Layer (if provided) – this is your own logic, not API-dependent if financing_params: financing = calculate_financing( content[‘median_home_value’], financing_params[‘down_payment_pct’], financing_params[‘interest_rate’], financing_params.get(‘loan_term’, 30) ) model[‘financing’] = financing # Recalculate profitability with mortgage monthly_cash_flow = model[‘profitability’][‘monthly_noi’] – financing[‘monthly_payment’] annual_cash_flow = monthly_cash_flow * 12 model[‘profitability’].update({ ‘monthly_cash_flow’: monthly_cash_flow, ‘annual_cash_flow’: annual_cash_flow, ‘cash_on_cash_return’: ( (annual_cash_flow / financing[‘total_invested’]) * 100 if financing[‘total_invested’] > 0 else None ), ‘break_even_months’: ( financing[‘total_invested’] / monthly_cash_flow if monthly_cash_flow > 0 else None ) }) return model |
C. How the Model Works
Revenue uses the API’s median_rental_income directly.
Expenses come from expenses_map, providing itemized monthly costs across all operating categories.
Profitability calculates NOI from revenue minus expenses, then applies financing costs if provided.
With the model architecture defined, we can now break down the inputs that drive revenue and expenses. These metrics map directly to fields inside the Lookup API response.
V. Revenue Model Inputs
median_rental_income: Expected monthly revenue based on real booking patterns.
median_night_rate: Typical nightly rate charged in the market.
median_occupancy_rate: Percentage of available nights booked. A 65% Airbnb occupancy rate equals 237 nights per year.
revpar: Revenue per available room (nightly rate × occupancy rate). Useful for comparing properties with different bedroom counts. Higher RevPAR indicates stronger market positioning.
median_guests_capacity: Maximum number of guests the property accommodates, which influences pricing potential.
VI. Expense Model Inputs
A. Core Expense Categories
propertyTax: Based on local tax rates and median home values
management: Typically 20–25% of gross revenue
maintenance: ~1% of property value annually (STRs experience 2–3× more wear than traditional rentals)
insurance: Property and liability coverage
utilities: Internet, electric, water, gas (host pays all utilities in STRs)
hoa_dues: Homeowner association fees (if applicable)
cleaningFees: Professional cleaning between guests
B. What’s Not Included
The Mashvisor Airbnb API doesn’t account for:
- Furniture and initial setup: $10,000-15,000 for a 2-bedroom property
- Airbnb host fees: 3% of gross bookings
- Licensing/permit fees: $200-2,000 annually depending on jurisdiction
Add these costs separately if building a complete investment calculator.
VII. Financing Layer (Optional)
A. What Financing Adds to the Model
- Monthly mortgage payment
- Down payment and closing costs
- Total cash invested
- Cash-on-cash return (annual cash flow ÷ total invested)
- Break-even timeline
B. Code: calculate_financing()
| def calculate_financing(home_value, down_pct, interest_rate, loan_term=30): “””Calculate mortgage and investment details (independent of Mashvisor).””” down_payment = home_value * (down_pct / 100) loan_amount = home_value – down_payment closing_costs = home_value * 0.03 monthly_rate = interest_rate / 12 / 100 num_payments = loan_term * 12 monthly_payment = loan_amount * ( monthly_rate * (1 + monthly_rate) ** num_payments ) / ((1 + monthly_rate) ** num_payments – 1) return { ‘down_payment’: down_payment, ‘loan_amount’: loan_amount, ‘closing_costs’: closing_costs, ‘total_invested’: down_payment + closing_costs, ‘monthly_payment’: monthly_payment, ‘interest_rate’: interest_rate, ‘loan_term’: loan_term, } |
C. How Financing Integrates
- Call calculate_financing() with property value and loan terms
- Subtract monthly mortgage payment from NOI to get actual cash flow
- Calculate cash-on-cash return using total cash invested (down payment + closing costs)
Once the revenue and financing layers are in place, the last step is ensuring the data is statistically reliable. Sample sizes and fallback logic are essential for building models that hold up in real-world products.
VIII. Data Quality, Sample Size Rules, and Fallback Logic
A. Sample-size Thresholds and Why They Matter
Use explicit, conservative thresholds to decide which geographic resolution is statistically reliable for modeling:
- Address-level: require sample_size ≥ 15 (suitable for specific property evaluation when there are at least 15 comparable short-term rental listings).
- Zip-level: require sample_size ≥ 30 (suitable for neighborhood-level analysis; fewer than 30 comps increases variance).
- City-level: require sample_size ≥ 80 (suitable for market-level analysis and robust medians).
When a resolution’s sample_size is below its threshold, the model should fall back to the next coarser resolution and display a data-quality warning to users. Using explicit thresholds reduces surprise from noisy medians and improves real-world reliability.
B. Fallback Logic (Address → Zip → City)
| Fallback flow (explicit thresholds) Address-level (require sample_size ≥ 15) ↓ if sample_size < 15 Zip-level (require sample_size ≥ 30) ↓ if sample_size < 30 City-level (require sample_size ≥ 80 for top confidence; return city-level response but surface warning if < 80) |
C. Code: Fallback Function
The fallback function implements multi-level resolution to ensure statistical reliability when the address-level sample size is small. Below is a short, readable overview that shows the behavior and thresholds; the complete production-ready implementation follows immediately after.
| # Fallback overview (full function below) def validate_and_fetch_data(location, api_key): “”” Behavior (overview): – Try address-level (if lat/lng provided) and require sample_size >= 15 – If below threshold, fall back to zip-level and require sample_size >= 30 – If below threshold, fall back to city-level and require sample_size >= 80 for highest confidence – Returns a tuple: (response_json, ‘address-level’ | ‘zip-level’ | ‘city-level’) Note: see full implementation below for logging, parameter sanitation, and exact request shapes. “”” pass # full implementation directly below |
Full Implementation
The full function performs the same steps, with defensive checks and clear logging so the calling code can surface user-facing warnings when data quality is low.
| def validate_and_fetch_data(location, api_key): “”” Fetch data with automatic fallback for low sample sizes. Resolution thresholds (conservative): – Address-level: require sample_size >= 15 – Zip-level: require sample_size >= 30 – City-level: require sample_size >= 80 (top confidence) Returns: (response_json, resolution_str) where resolution_str is one of ‘address-level’, ‘zip-level’, ‘city-level’ “”” # Address-level first (if coordinates are provided) if ‘lat’ in location and ‘lng’ in location: response = get_market_data(location, api_key) content = response.get(‘content’) or {} if content.get(‘sample_size’, 0) >= 15: return response, ‘address-level’ # log fallback intent print(f”[data-quality] address comps={content.get(‘sample_size’, 0)} < 15. Falling back to zip-level.”) # Fall back to zip code level (if provided) if ‘zip_code’ in location: zip_params = {k: v for k, v in location.items() if k not in [‘address’, ‘lat’, ‘lng’]} response = get_market_data(zip_params, api_key) content = response.get(‘content’) or {} if content.get(‘sample_size’, 0) >= 30: return response, ‘zip-level’ print(f”[data-quality] zip comps={content.get(‘sample_size’, 0)} < 30. Falling back to city-level.”) # Final fallback: city level (state + city required) city_params = { ‘state’: location.get(‘state’), ‘city’: location.get(‘city’), ‘beds’: location.get(‘beds’), ‘resource’: location.get(‘resource’, ‘airbnb’) } response = get_market_data(city_params, api_key) content = response.get(‘content’) or {} # Return city-level response in all cases, but callers/UI should surface a warning # if sample_size < 80 (city-level is less reliable below this threshold). if content.get(‘sample_size’, 0) < 80: print(f”[data-quality] city comps={content.get(‘sample_size’, 0)} < 80. Display low-confidence warning to user.”) return response, ‘city-level’ |
D. When to Display Warnings
Warnings should be tied directly to the sample-size quality classification:
- very_low (sample_size < 15):
Show a strong warning — address-level data is statistically unreliable.
Encourage falling back to ZIP or city level. - low (15 ≤ sample_size < 30):
Show a warning — ZIP-level data has too few comps for stable medians. - medium (30 ≤ sample_size < 80):
Show a soft warning — city-level medians are usable but should be presented with a confidence disclaimer. - high (sample_size ≥ 80):
No warning needed — data is statistically robust at city level.
Pro tip: always display a visual warning (icon or banner) when quality is very_low, low, or medium, and only suppress warnings at the high level.
IX. Final Output Formatting
A. Code: format_revenue_summary()
| def format_revenue_summary(model): “””Create readable summary of revenue model””” price_to_rent = model[‘metadata’].get(‘price_to_rent_ratio’) regulations = model[‘metadata’].get(‘regulations’) # — NEW: compute sample-size quality label (use model label if present) — sample_size = model[‘metadata’].get(‘sample_size’) quality = model[‘metadata’].get(‘data_quality’) if not quality: if sample_size is None: quality = ‘unknown’ else: try: _s = int(sample_size) except (TypeError, ValueError): quality = ‘unknown’ else: if _s >= 80: quality = ‘high’ elif _s >= 30: quality = ‘medium’ elif _s >= 15: quality = ‘low’ else: quality = ‘very_low’ # — NEW: prepare explicit warning text based on quality — warning_lines = [] if quality == ‘very_low’: warning_lines.append(” ⚠️ Data quality: VERY LOW — insufficient comps at this resolution. Consider a coarser geographic level.”) elif quality == ‘low’: warning_lines.append(” ⚠️ Data quality: LOW — medians may be unstable; use caution or fall back to zip/city analysis.”) elif quality == ‘medium’: warning_lines.append(” ℹ️ Data quality: MEDIUM — directional insights only; consider additional validation.”) # ‘high’ -> no warning line # — ORIGINAL FSTRING (with minimal edits to inject quality + warnings) — return f””” ╔═══════════════════════════════════════════════════════════╗ ║ AIRBNB REVENUE MODEL ║ ╚═══════════════════════════════════════════════════════════╝ 📍 PROPERTY Location: {model[‘property’][‘location’]} Market ID: {model[‘property’][‘market_id’]} Median Value: ${model[‘property’][‘median_value’]:,.0f} 💰 REVENUE PROJECTIONS Monthly Income: ${model[‘revenue’][‘monthly_income’]:,.0f} Annual Income: ${model[‘revenue’][‘annual_income’]:,.0f} Nightly Rate: ${model[‘revenue’][‘nightly_rate’]:.0f} Occupancy Rate: {model[‘revenue’][‘occupancy_rate’]}% RevPAR: ${model[‘revenue’][‘revpar’]:.2f} Guest Capacity: {model[‘revenue’][‘guest_capacity’]} guests 💸 MONTHLY EXPENSES Total: ${model[‘expenses’][‘monthly_total’]:,.0f} ├─ Property Tax: ${model[‘expenses’][‘property_tax’]:,.0f} ├─ Management: ${model[‘expenses’][‘management’]:,.0f} ├─ Maintenance: ${model[‘expenses’][‘maintenance’]:,.0f} ├─ Insurance: ${model[‘expenses’][‘insurance’]:,.0f} ├─ Utilities: ${model[‘expenses’][‘utilities’]:,.0f} ├─ HOA Dues: ${model[‘expenses’][‘hoa_dues’]:,.0f} └─ Cleaning: ${model[‘expenses’][‘cleaning’]:,.0f} {‘🏦 FINANCING’ if ‘financing’ in model else ”} {‘ Down Payment ({}%): ${:,.0f}’.format( model[‘financing’][‘down_payment’] / model[‘property’][‘median_value’] * 100, model[‘financing’][‘down_payment’] ) if ‘financing’ in model else ”} {‘ Loan Amount: ${:,.0f}’.format(model[‘financing’][‘loan_amount’]) if ‘financing’ in model else ”} {‘ Monthly Mortgage: ${:,.0f}’.format(model[‘financing’][‘monthly_payment’]) if ‘financing’ in model else ”} {‘ Interest Rate: {}%’.format(model[‘financing’][‘interest_rate’]) if ‘financing’ in model else ”} 📊 PROFITABILITY Monthly NOI: ${model[‘profitability’][‘monthly_noi’]:,.0f} {‘ Monthly Cash Flow: ${:,.0f}’.format(model[‘profitability’].get(‘monthly_cash_flow’, 0)) if ‘financing’ in model else ”} {‘ Annual Cash Flow: ${:,.0f}’.format(model[‘profitability’].get(‘annual_cash_flow’, 0)) if ‘financing’ in model else ”} Cap Rate: {model[‘profitability’][‘cap_rate’]}% {‘ Cash-on-Cash Return: {:.1f}%’.format(model[‘profitability’].get(‘cash_on_cash_return’, 0)) if ‘financing’ in model else ”} {‘ Break-Even Timeline: {} months’.format(int(model[‘profitability’][‘break_even_months’])) if ‘financing’ in model and model[‘profitability’].get(‘break_even_months’) else ”} 📈 DATA QUALITY Sample Size: {sample_size} Data Quality: {quality.title() if isinstance(quality, str) else ‘N/A’} Price-to-Rent Ratio: {f”{price_to_rent:.1f}“ if price_to_rent is not None else “N/A”} {f” ⚠️ Regulatory Note: {regulations}“ if regulations else “”} {(‘\\n’.join(warning_lines) + ‘\\n’) if warning_lines else ”} Generated: {model[‘metadata’].get(‘analysis_date’)} Data Source: Mashvisor API “”” |
B. Complete Usage Example
| # Define location and financing parameters location = { ‘state’: ‘TX’, ‘city’: ‘Austin’, ‘zip_code’: ‘78701’, ‘beds’: 2, ‘baths’: 2, ‘resource’: ‘airbnb’ } financing = { ‘down_payment_pct’: 25, ‘interest_rate’: 6.5, ‘loan_term’: 30 } # Get data from Mashvisor lookup endpoint api_response = get_market_data(location) # Build revenue model from lookup response + financing layer revenue_model = build_revenue_model(api_response, financing) # Display formatted model print(format_revenue_summary(revenue_model)) |
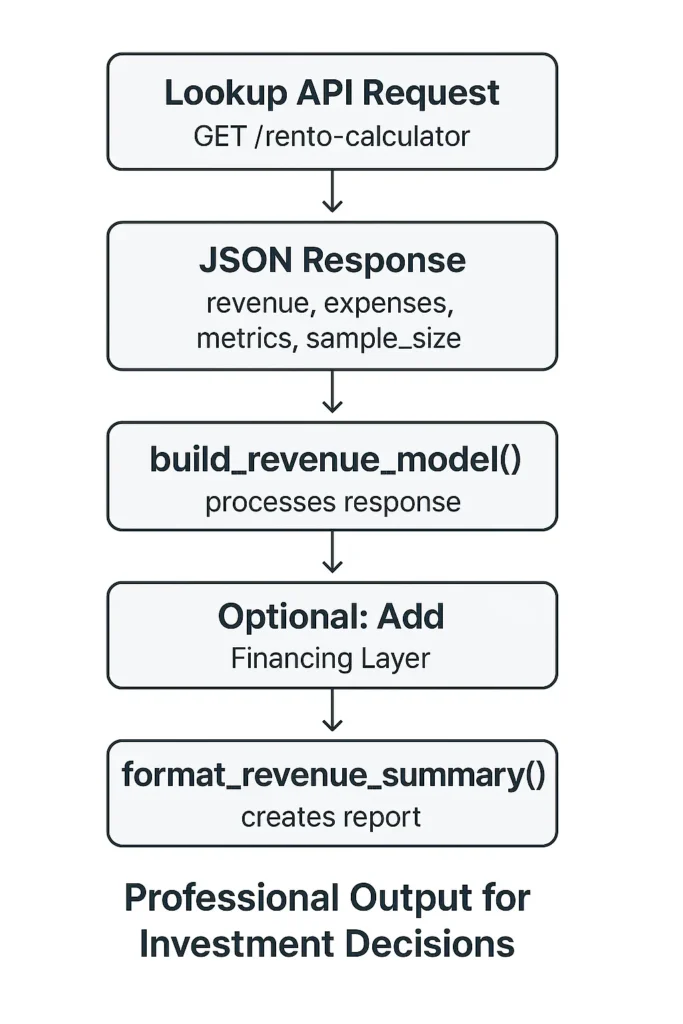
C. Model Flow
X.How Mashvisor Lookup API Compares to Zillow & AirDna
AirDNA:
AirDna provides strong top-level market analytics but does not return property-level financial metrics (NOI, cash flow, expenses, cash-on-cash) in a single API call. Developers must combine multiple datasets and calculate profitability manually.
Zillow:
Zillow offers property data and rental estimates but does not provide short-term rental income, occupancy rates, RevPAR, or Airbnb-specific expenses. It is not designed for STR financial modeling.
Mashvisor Lookup:
Unlike both, Lookup returns complete, pre-modeled Airbnb financials — revenue, occupancy, itemized expenses, profitability metrics, RevPAR, and data-quality flags — ready for direct use in production applications.
Conclusion: Mashvisor Lookup API Is the Fastest Path to a Production-Ready Airbnb Model
The Mashvisor API provides everything needed to build reliable Airbnb revenue models:
- Complete financial data in a single API call — no scraping, no data cleaning
- Pre-calculated metrics including NOI, cap rate, and cash-on-cash return
- Nationwide coverage across all 50 US states plus select international markets
- Quality indicators via sample sizes and fallback logic for reliable projections
- Production-ready within hours, not months of custom development
Build models that use API data directly, handle low sample sizes gracefully, display quality indicators prominently, calculate financing impact accurately, and present results in actionable formats.
Start using the Mashvisor API today with a 1-week free trial that includes 30 credits for real market queries.