In this article, we ranked the 100 best short term rental markets in 2026 that you should invest in based on data from Mashvisor.
In 2025, the US short term rental industry hit a turning point. Supply growth slowed to 6.9% (down from 22.3% in 2022) as high interest rates and home prices made new listings harder to add. Meanwhile, demand jumped 7% and pushed revenue per available room (RevPAR) up 3.4%.
And because urban areas faced stricter regulations and housing shortages, long-term rental investment became more attractive. While some states tightened restrictions, others pushed back.
Table of Contents
- Criteria Used to Filter These Lists
- 2025 Best Short Term Rental Markets With $2,000 to $3,000 Monthly Income
- 2025 Best Short Term Rental Markets With $3,001 to $4,000 Monthly Income
- 2025 Best Short Term Rental Markets With $4,001 to $5,000 Monthly Income
- 2025 Best Short Term Rental Markets With $5,001+ Monthly Income
- How to Find the Best Short Term Rental Investments
This year, demand in the short term rental industry is expected to grow modestly as economic conditions improve and consumer purchasing power strengthen. Plus, the US will see more inbound travel from all over the world. According to the National Travel and Tourism Office (NTTO), the country is expected to welcome approximately 77.1 million international visitors this year, marking a 6.5% increase from 2025.
Unfortunately, the housing market remains a mixed bag for investors looking to buy, but those with existing vacation rentals should see this as a good sign. As long as home prices stay high, fewer new vacation rentals will pop up, lowering potential competition. But if you’re an investor who’s been thinking of buying a short term rental for sale, you should still do it if you can afford to.
Below is our list of the 100 best cash flow short term rental markets in 2026. We grouped them by their average monthly income, starting at $2,000, so feel free to jump to the section that meets your investment targets.
Criteria Used to Filter These Lists
When ranking the top 100 short term rental markets, we considered the different metrics that determine each location’s profitability. These include monthly income, average daily rate, occupancy rate, and cash on cash return.
We went over Mashvisor’s April 2026 data and used the following criteria to show you only the best and most profitable properties for cash flow generation:
- Each location must have a median property price that does not exceed $1,000,000;
- Each location must have at least 100 active listings on the short term rental market to indicate demand for vacation rentals;
- Each location must have no less than 2.00% cash on cash return to guarantee profitability; and,
- Each location must have an Airbnb occupancy rate of 50% or more for more significant income opportunities.
Disclaimer: This does not automatically mean that vacation rentals are legal in the listed cities. We encourage you to call the appropriate local government office or check out our short term rental rules and regulations guide beforehand.
2026 Best Short Term Rental Markets With $2,000 to $3,000 Monthly Income
The cities included in this section are generally low-profile tourist destinations and are often used as pit stops. These locations are also perfect for beginner investors who do not have a lot of capital yet.
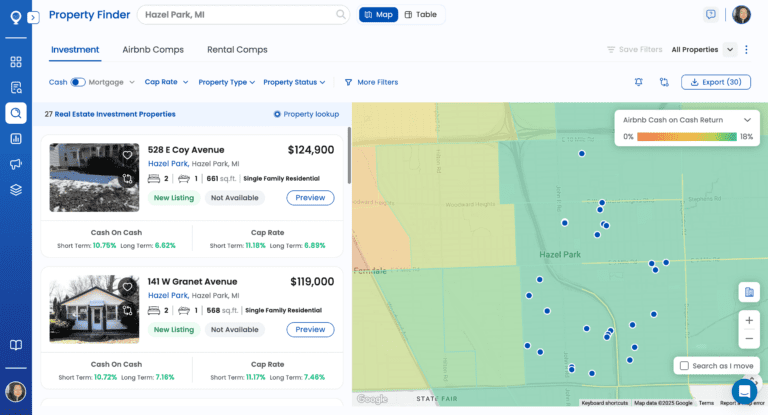
1. Hazel Park, MI
- Median Property Price: $208,955
- Average Price per Square Foot: $189
- Days on Market: 60
- Number of Short Term Rental Comps: 269
- Monthly Short Term Rental Income: $2,557
- Short Term Rental Cash on Cash Return: 7.45%
- Short Term Rental Cap Rate: 7.66%
- Short Term Rental Daily Rate: $170
- Short Term Rental Occupancy Rate: 53%
- Walk Score: 85
2. Madison Heights, VA
- Median Property Price: $309,276
- Average Price per Square Foot: $178
- Days on Market: 55
- Number of Short Term Rental Comps: 129
- Monthly Short Term Rental Income: $2,768
- Short Term Rental Cash on Cash Return: 6.89%
- Short Term Rental Cap Rate: 7.04%
- Short Term Rental Daily Rate: $141
- Short Term Rental Occupancy Rate: 53%
- Walk Score: 32
3. Madison Heights, MI
- Median Property Price: $226,494
- Average Price per Square Foot: $217
- Days on Market: 43
- Number of Short Term Rental Comps: 301
- Monthly Short Term Rental Income: $2,574
- Short Term Rental Cash on Cash Return: 6.37%
- Short Term Rental Cap Rate: 6.53%
- Short Term Rental Daily Rate: $168
- Short Term Rental Occupancy Rate: 54%
- Walk Score: 75
4. Lauderdale Lakes, FL
- Median Property Price: $243,161
- Average Price per Square Foot: $285
- Number of Short Term Rental Comps: 1,188
- Monthly Short Term Rental Income: $2,476
- Short Term Rental Cash on Cash Return: 6.26%
- Short Term Rental Cap Rate: 6.45%
- Short Term Rental Daily Rate: $194
- Short Term Rental Occupancy Rate: 60%
- Walk Score: 61
5. Palm Springs, FL
- Median Property Price: $286,093
- Average Price per Square Foot: $270
- Number of Short Term Rental Comps: 462
- Monthly Short Term Rental Income: $2,434
- Short Term Rental Cash on Cash Return: 6.00%
- Short Term Rental Cap Rate: 6.16%
- Short Term Rental Daily Rate: $210
- Short Term Rental Occupancy Rate: 56%
- Walk Score: 29
6. Portsmouth, VA
- Median Property Price: $292,769
- Average Price per Square Foot: $188
- Days on Market: 55
- Number of Short Term Rental Comps: 168
- Monthly Short Term Rental Income: $2,748
- Short Term Rental Cash on Cash Return: 5.95%
- Short Term Rental Cap Rate: 6.07%
- Short Term Rental Daily Rate: $153
- Short Term Rental Occupancy Rate: 55%
- Walk Score: 30
7. Clawson, MI
- Median Property Price: $278,856
- Average Price per Square Foot: $250
- Days on Market: 33
- Number of Short Term Rental Comps: 149
- Monthly Short Term Rental Income: $2,975
- Short Term Rental Cash on Cash Return: 5.90%
- Short Term Rental Cap Rate: 6.02%
- Short Term Rental Daily Rate: $174
- Short Term Rental Occupancy Rate: 53%
- Walk Score: 89
8. Oak Park, MI
- Median Property Price: $274,575
- Average Price per Square Foot: $197
- Days on Market: 155
- Number of Short Term Rental Comps: 225
- Monthly Short Term Rental Income: $2,922
- Short Term Rental Cash on Cash Return: 5.83%
- Short Term Rental Cap Rate: 5.95%
- Short Term Rental Daily Rate: $168
- Short Term Rental Occupancy Rate: 51%
- Walk Score: 79
9. Carlsbad, NM
- Median Property Price: $292,438
- Average Price per Square Foot: $168
- Days on Market: 236
- Number of Short Term Rental Comps: 130
- Monthly Short Term Rental Income: $2,587
- Short Term Rental Cash on Cash Return: 5.74%
- Short Term Rental Cap Rate: 5.86%
- Short Term Rental Daily Rate: $153
- Short Term Rental Occupancy Rate: 54%
- Walk Score: 77
10. Holiday, FL
- Median Property Price: $284,821
- Average Price per Square Foot: $213
- Days on Market: 102
- Number of Short Term Rental Comps: 388
- Monthly Short Term Rental Income: $2,673
- Short Term Rental Cash on Cash Return: 5.71%
- Short Term Rental Cap Rate: 5.83%
- Short Term Rental Daily Rate: $155
- Short Term Rental Occupancy Rate: 58%
- Walk Score: 70
11. Port Richey, FL
- Median Property Price: $291,722
- Average Price per Square Foot: $212
- Days on Market: 87
- Number of Short Term Rental Comps: 174
- Monthly Short Term Rental Income: $2,765
- Short Term Rental Cash on Cash Return: 5.67%
- Short Term Rental Cap Rate: 5.79%
- Short Term Rental Daily Rate: $163
- Short Term Rental Occupancy Rate: 59%
- Walk Score: 49
12. Kingman, AZ
- Median Property Price: $318,401
- Average Price per Square Foot: $201
- Days on Market: 90
- Number of Short Term Rental Comps: 122
- Monthly Short Term Rental Income: $2,545
- Short Term Rental Cash on Cash Return: 5.54%
- Short Term Rental Cap Rate: 5.65%
- Short Term Rental Daily Rate: $144
- Short Term Rental Occupancy Rate: 55%
- Walk Score: 49
13. Columbia, MO
- Median Property Price: $355,245
- Average Price per Square Foot: $165
- Days on Market: 74
- Number of Short Term Rental Comps: 224
- Monthly Short Term Rental Income: $2,536
- Short Term Rental Cash on Cash Return: 5.50%
- Short Term Rental Cap Rate: 5.62%
- Short Term Rental Daily Rate: $164
- Short Term Rental Occupancy Rate: 50%
- Walk Score: 32
14. Wichita, KS
- Median Property Price: $319,274
- Average Price per Square Foot: $145
- Days on Market: 72
- Number of Short Term Rental Comps: 384
- Monthly Short Term Rental Income: $2,499
- Short Term Rental Cash on Cash Return: 5.46%
- Short Term Rental Cap Rate: 5.59%
- Short Term Rental Daily Rate: $137
- Short Term Rental Occupancy Rate: 52%
- Walk Score: 43
15. Sierra Vista, AZ
- Median Property Price: $367,072
- Average Price per Square Foot: $191
- Days on Market: 71
- Number of Short Term Rental Comps: 105
- Monthly Short Term Rental Income: $2,924
- Short Term Rental Cash on Cash Return: 5.45%
- Short Term Rental Cap Rate: 5.54%
- Short Term Rental Daily Rate: $142
- Short Term Rental Occupancy Rate: 62%
- Walk Score: 24
16. Columbus, GA
- Median Property Price: $350,526
- Average Price per Square Foot: $147
- Days on Market: 134
- Number of Short Term Rental Comps: 239
- Monthly Short Term Rental Income: $2,657
- Short Term Rental Cash on Cash Return: 5.33%
- Short Term Rental Cap Rate: 5.45%
- Short Term Rental Daily Rate: $135
- Short Term Rental Occupancy Rate: 59%
- Walk Score: 37
17. Spartanburg, SC
- Median Property Price: $342,305
- Average Price per Square Foot: $175
- Days on Market: 73
- Number of Short Term Rental Comps: 128
- Monthly Short Term Rental Income: $2,342
- Short Term Rental Cash on Cash Return: 5.29%
- Short Term Rental Cap Rate: 5.41%
- Short Term Rental Daily Rate: $136
- Short Term Rental Occupancy Rate: 52%
- Walk Score: 27
18. Montgomery, AL
- Median Property Price: $307,172
- Average Price per Square Foot: $178
- Days on Market: 63
- Number of Short Term Rental Comps: 139
- Monthly Short Term Rental Income: $2,643
- Short Term Rental Cash on Cash Return: 5.23%
- Short Term Rental Cap Rate: 5.31%
- Short Term Rental Daily Rate: $120
- Short Term Rental Occupancy Rate: 52%
- Walk Score: 56
19. Valdosta, GA
- Median Property Price: $344,104
- Average Price per Square Foot: $163
- Days on Market: 75
- Number of Short Term Rental Comps: 120
- Monthly Short Term Rental Income: $2,455
- Short Term Rental Cash on Cash Return: 5.10%
- Short Term Rental Cap Rate: 5.21%
- Short Term Rental Daily Rate: $126
- Short Term Rental Occupancy Rate: 51%
- Walk Score: 40
20. Alma, GA
- Median Property Price: $298,100
- Average Price per Square Foot: $135
- Days on Market: 142
- Number of Short Term Rental Comps: 137
- Monthly Short Term Rental Income: $2,785
- Short Term Rental Cash on Cash Return: 5.07%
- Short Term Rental Cap Rate: 5.15%
- Short Term Rental Daily Rate: $202
- Short Term Rental Occupancy Rate: 55%
- Walk Score: 61
21. West Saint Paul, MN
- Median Property Price: $281,472
- Average Price per Square Foot: $183
- Days on Market: 43
- Number of Short Term Rental Comps: 205
- Monthly Short Term Rental Income: $2,881
- Short Term Rental Cash on Cash Return: 5.05%
- Short Term Rental Cap Rate: 5.15%
- Short Term Rental Daily Rate: $174
- Short Term Rental Occupancy Rate: 52%
- Walk Score: 78
22. Wilmington, DE
- Median Property Price: $447,259
- Average Price per Square Foot: $242
- Days on Market: 70
- Number of Short Term Rental Comps: 129
- Monthly Short Term Rental Income: $2,741
- Short Term Rental Cash on Cash Return: 5.01%
- Short Term Rental Cap Rate: 5.11%
- Short Term Rental Daily Rate: $142
- Short Term Rental Occupancy Rate: 53%
- Walk Score: 72
23. Hope Mills, NC
- Median Property Price: $311,008
- Average Price per Square Foot: $156
- Days on Market: 124
- Number of Short Term Rental Comps: 100
- Monthly Short Term Rental Income: $2,593
- Short Term Rental Cash on Cash Return: 4.96%
- Short Term Rental Cap Rate: 5.05%
- Short Term Rental Daily Rate: $115
- Short Term Rental Occupancy Rate: 62%
- Walk Score: 53
24. Fort Wayne, IN
- Median Property Price: $341,928
- Average Price per Square Foot: $169
- Days on Market: 72
- Number of Short Term Rental Comps: 387
- Monthly Short Term Rental Income: $2,652
- Short Term Rental Cash on Cash Return: 4.95%
- Short Term Rental Cap Rate: 5.05%
- Short Term Rental Daily Rate: $144
- Short Term Rental Occupancy Rate: 53%
- Walk Score: 38
25. Laredo, TX
- Median Property Price: $305,076
- Average Price per Square Foot: $160
- Days on Market: 79
- Number of Short Term Rental Comps: 190
- Monthly Short Term Rental Income: $2,694
- Short Term Rental Cash on Cash Return: 4.94%
- Short Term Rental Cap Rate: 5.03%
- Short Term Rental Daily Rate: $129
- Short Term Rental Occupancy Rate: 53%
- Walk Score: 59
2026 Best Short Term Rental Markets With $3,001 to $4,000 Monthly Income
The locations featured in this section are primarily outdoor tourist destinations and cities near metropolitan areas, which always get a lot of leisure and business travelers. Beginners may also find affordable properties here.
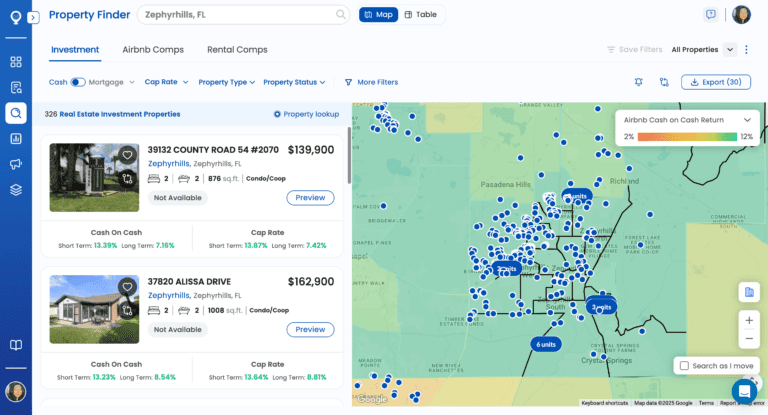
26. Zephyrhills, FL
- Median Property Price: $343,227
- Average Price per Square Foot: $199
- Days on Market: 104
- Number of Short Term Rental Comps: 118
- Monthly Short Term Rental Income: $3,863
- Short Term Rental Cash on Cash Return: 7.17%
- Short Term Rental Cap Rate: 7.29%
- Short Term Rental Daily Rate: $132
- Short Term Rental Occupancy Rate: 68%
- Walk Score: 69
27. Silver Springs, NV
- Median Property Price: $305,432
- Average Price per Square Foot: $237
- Days on Market: 131
- Number of Short Term Rental Comps: 104
- Monthly Short Term Rental Income: $3,115
- Short Term Rental Cash on Cash Return: 7.12%
- Short Term Rental Cap Rate: 7.25%
- Short Term Rental Daily Rate: $187
- Short Term Rental Occupancy Rate: 60%
- Walk Score: 34
28. Cayce, SC
- Median Property Price: $303,345
- Average Price per Square Foot: $188
- Days on Market: 64
- Number of Short Term Rental Comps: 105
- Monthly Short Term Rental Income: $3,060
- Short Term Rental Cash on Cash Return: 6.83%
- Short Term Rental Cap Rate: 6.96%
- Short Term Rental Daily Rate: $144
- Short Term Rental Occupancy Rate: 52%
- Walk Score: 43
29. River Oaks, TX
- Median Property Price: $307,009
- Average Price per Square Foot: $213
- Number of Short Term Rental Comps: 176
- Monthly Short Term Rental Income: $3,411
- Short Term Rental Cash on Cash Return: 6.78%
- Short Term Rental Cap Rate: 6.90%
- Short Term Rental Daily Rate: $204
- Short Term Rental Occupancy Rate: 58%
- Walk Score: 73
30. Tabor City, NC
- Median Property Price: $315,328
- Average Price per Square Foot: $186
- Days on Market: 203
- Number of Short Term Rental Comps: 315
- Monthly Short Term Rental Income: $3,216
- Short Term Rental Cash on Cash Return: 6.75%
- Short Term Rental Cap Rate: 6.87%
- Short Term Rental Daily Rate: $243
- Short Term Rental Occupancy Rate: 54%
- Walk Score: 47
31. Richfield, MN
- Median Property Price: $334,103
- Average Price per Square Foot: $202
- Days on Market: 55
- Number of Short Term Rental Comps: 216
- Monthly Short Term Rental Income: $3,798
- Short Term Rental Cash on Cash Return: 6.67%
- Short Term Rental Cap Rate: 6.79%
- Short Term Rental Daily Rate: $200
- Short Term Rental Occupancy Rate: 53%
- Walk Score: 85
32. West Columbia, SC
- Median Property Price: $331,315
- Average Price per Square Foot: $163
- Days on Market: 54
- Number of Short Term Rental Comps: 217
- Monthly Short Term Rental Income: $3,303
- Short Term Rental Cash on Cash Return: 6.59%
- Short Term Rental Cap Rate: 6.70%
- Short Term Rental Daily Rate: $163
- Short Term Rental Occupancy Rate: 53%
- Walk Score: 61
33. Hampton, VA
- Median Property Price: $352,295
- Average Price per Square Foot: $215
- Days on Market: 56
- Number of Short Term Rental Comps: 236
- Monthly Short Term Rental Income: $3,257
- Short Term Rental Cash on Cash Return: 6.59%
- Short Term Rental Cap Rate: 6.71%
- Short Term Rental Daily Rate: $221
- Short Term Rental Occupancy Rate: 52%
- Walk Score: 38
34. Kenneth City, FL
- Median Property Price: $361,574
- Average Price per Square Foot: $270
- Days on Market: 100
- Number of Short Term Rental Comps: 1,827
- Monthly Short Term Rental Income: $3,790
- Short Term Rental Cash on Cash Return: 6.50%
- Short Term Rental Cap Rate: 6.64%
- Short Term Rental Daily Rate: $179
- Short Term Rental Occupancy Rate: 61%
- Walk Score: 51
35. Deerfield Beach, FL
- Median Property Price: $446,693
- Average Price per Square Foot: $388
- Number of Short Term Rental Comps: 431
- Monthly Short Term Rental Income: $3,620
- Short Term Rental Cash on Cash Return: 6.46%
- Short Term Rental Cap Rate: 6.59%
- Short Term Rental Daily Rate: $242
- Short Term Rental Occupancy Rate: 60%
- Walk Score: 78
36. Sun City Center, FL
- Median Property Price: $312,708
- Average Price per Square Foot: $193
- Days on Market: 117
- Number of Short Term Rental Comps: 107
- Monthly Short Term Rental Income: $3,283
- Short Term Rental Cash on Cash Return: 6.11%
- Short Term Rental Cap Rate: 6.23%
- Short Term Rental Daily Rate: $246
- Short Term Rental Occupancy Rate: 56%
- Walk Score: 29
37. El Mirage, AZ
- Median Property Price: $352,341
- Average Price per Square Foot: $259
- Days on Market: 76
- Number of Short Term Rental Comps: 146
- Monthly Short Term Rental Income: $3,283
- Short Term Rental Cash on Cash Return: 6.07%
- Short Term Rental Cap Rate: 6.16%
- Short Term Rental Daily Rate: $185
- Short Term Rental Occupancy Rate: 51%
- Walk Score: 60
38. Sopchoppy, FL
- Median Property Price: $402,271
- Average Price per Square Foot: $252
- Days on Market: 135
- Number of Short Term Rental Comps: 142
- Monthly Short Term Rental Income: $3,711
- Short Term Rental Cash on Cash Return: 6.07%
- Short Term Rental Cap Rate: 6.15%
- Short Term Rental Daily Rate: $172
- Short Term Rental Occupancy Rate: 55%
- Walk Score: 29
39. Spring Hill, FL
- Median Property Price: $370,188
- Average Price per Square Foot: $200
- Days on Market: 90
- Number of Short Term Rental Comps: 279
- Monthly Short Term Rental Income: $3,464
- Short Term Rental Cash on Cash Return: 6.06%
- Short Term Rental Cap Rate: 6.16%
- Short Term Rental Daily Rate: $179
- Short Term Rental Occupancy Rate: 62%
- Walk Score: 40
40. Willard, NC
- Median Property Price: $396,114
- Average Price per Square Foot: $245
- Days on Market: 86
- Number of Short Term Rental Comps: 115
- Monthly Short Term Rental Income: $3,439
- Short Term Rental Cash on Cash Return: 6.02%
- Short Term Rental Cap Rate: 6.10%
- Short Term Rental Daily Rate: $204
- Short Term Rental Occupancy Rate: 56%
- Walk Score: 6
41. Inverness, FL
- Median Property Price: $324,397
- Average Price per Square Foot: $204
- Days on Market: 108
- Number of Short Term Rental Comps: 127
- Monthly Short Term Rental Income: $3,047
- Short Term Rental Cash on Cash Return: 5.98%
- Short Term Rental Cap Rate: 6.09%
- Short Term Rental Daily Rate: $163
- Short Term Rental Occupancy Rate: 58%
- Walk Score: 30
42. Weeki Wachee, FL
- Median Property Price: $428,040
- Average Price per Square Foot: $230
- Days on Market: 111
- Number of Short Term Rental Comps: 291
- Monthly Short Term Rental Income: $3,721
- Short Term Rental Cash on Cash Return: 5.82%
- Short Term Rental Cap Rate: 5.91%
- Short Term Rental Daily Rate: $186
- Short Term Rental Occupancy Rate: 62%
- Walk Score: 33
43. Broadview, IL
- Median Property Price: $278,950
- Average Price per Square Foot: $214
- Days on Market: 78
- Number of Short Term Rental Comps: 108
- Monthly Short Term Rental Income: $3,031
- Short Term Rental Cash on Cash Return: 5.82%
- Short Term Rental Cap Rate: 5.93%
- Short Term Rental Daily Rate: $212
- Short Term Rental Occupancy Rate: 56%
- Walk Score: 79
44. Cicero, IL
- Median Property Price: $337,706
- Average Price per Square Foot: $218
- Days on Market: 84
- Number of Short Term Rental Comps: 224
- Monthly Short Term Rental Income: $3,597
- Short Term Rental Cash on Cash Return: 5.79%
- Short Term Rental Cap Rate: 5.89%
- Short Term Rental Daily Rate: $192
- Short Term Rental Occupancy Rate: 52%
- Walk Score: 82
45. Casa Grande, AZ
- Median Property Price: $375,513
- Average Price per Square Foot: $204
- Days on Market: 82
- Number of Short Term Rental Comps: 117
- Monthly Short Term Rental Income: $3,259
- Short Term Rental Cash on Cash Return: 5.78%
- Short Term Rental Cap Rate: 5.87%
- Short Term Rental Daily Rate: $199
- Short Term Rental Occupancy Rate: 51%
- Walk Score: 8
46. Green Acres, FL
- Median Property Price: $293,163
- Average Price per Square Foot: $232
- Days on Market: 50
- Number of Short Term Rental Comps: 256
- Monthly Short Term Rental Income: $3,269
- Short Term Rental Cash on Cash Return: 5.77%
- Short Term Rental Cap Rate: 5.90%
- Short Term Rental Daily Rate: $221
- Short Term Rental Occupancy Rate: 59%
- Walk Score: 29
47. Colonial Beach, VA
- Median Property Price: $378,300
- Average Price per Square Foot: $248
- Days on Market: 90
- Number of Short Term Rental Comps: 120
- Monthly Short Term Rental Income: $3,247
- Short Term Rental Cash on Cash Return: 5.74%
- Short Term Rental Cap Rate: 5.82%
- Short Term Rental Daily Rate: $224
- Short Term Rental Occupancy Rate: 52%
- Walk Score: 60
48. Seffner, FL
- Median Property Price: $443,477
- Average Price per Square Foot: $239
- Days on Market: 118
- Number of Short Term Rental Comps: 156
- Monthly Short Term Rental Income: $3,939
- Short Term Rental Cash on Cash Return: 5.70%
- Short Term Rental Cap Rate: 5.78%
- Short Term Rental Daily Rate: $162
- Short Term Rental Occupancy Rate: 62%
- Walk Score: 27
49. Bisbee, AZ
- Median Property Price: $346,523
- Average Price per Square Foot: $267
- Days on Market: 204
- Number of Short Term Rental Comps: 129
- Monthly Short Term Rental Income: $3,034
- Short Term Rental Cash on Cash Return: 5.65%
- Short Term Rental Cap Rate: 5.74%
- Short Term Rental Daily Rate: $163
- Short Term Rental Occupancy Rate: 52%
- Walk Score: 27
50. Ellenton, FL
- Median Property Price: $429,305
- Average Price per Square Foot: $226
- Days on Market: 96
- Number of Short Term Rental Comps: 328
- Monthly Short Term Rental Income: $3,505
- Short Term Rental Cash on Cash Return: 5.61%
- Short Term Rental Cap Rate: 5.70%
- Short Term Rental Daily Rate: $196
- Short Term Rental Occupancy Rate: 59%
- Walk Score: 45
2026 Best Short Term Rental Markets With $4,001 to $5,000 Monthly Income
Beginner investors might have difficulty finding cheaper properties in the areas in this tier. Meanwhile, experienced investors with more capital might discover an excellent second or third property in these 25 cities.
51. Highland Park, PA
- Median Property Price: $443,000
- Days on Market: 110
- Number of Short Term Rental Comps: 218
- Monthly Short Term Rental Income: $4,533
- Short Term Rental Cash on Cash Return: 6.97%
- Short Term Rental Cap Rate: 7.06%
- Short Term Rental Daily Rate: $197
- Short Term Rental Occupancy Rate: 51%
- Walk Score: 51
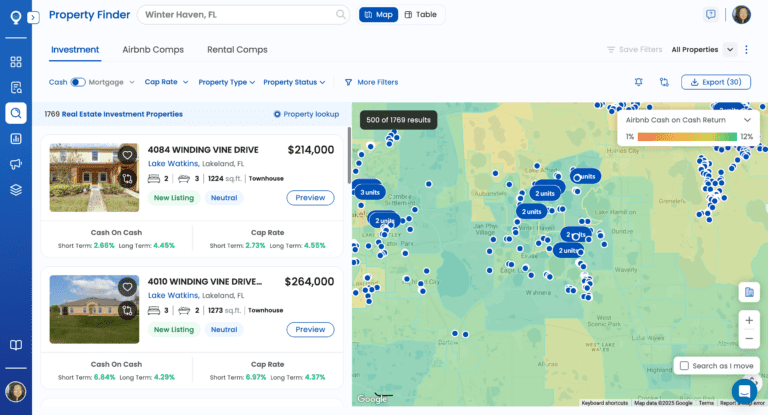
52. Winter Haven, FL
- Median Property Price: $386,487
- Average Price per Square Foot: $194
- Days on Market: 99
- Number of Short Term Rental Comps: 164
- Monthly Short Term Rental Income: $4,011
- Short Term Rental Cash on Cash Return: 6.95%
- Short Term Rental Cap Rate: 7.06%
- Short Term Rental Daily Rate: $162
- Short Term Rental Occupancy Rate: 77
- Walk Score: 79
53. Visalia, CA
- Median Property Price: $430,516
- Average Price per Square Foot: $279
- Days on Market: 62
- Number of Short Term Rental Comps: 175
- Monthly Short Term Rental Income: $4,442
- Short Term Rental Cash on Cash Return: 6.91%
- Short Term Rental Cap Rate: 7.00%
- Short Term Rental Daily Rate: $164
- Short Term Rental Occupancy Rate: 86%
- Walk Score: 53
54. Homosassa, FL
- Median Property Price: $440,894
- Average Price per Square Foot: $236
- Days on Market: 92
- Number of Short Term Rental Comps: 175
- Monthly Short Term Rental Income: $4,014
- Short Term Rental Cash on Cash Return: 6.53%
- Short Term Rental Cap Rate: 6.62%
- Short Term Rental Daily Rate: $201
- Short Term Rental Occupancy Rate: 57%
- Walk Score: 38
55. Cape Carteret, NC
- Median Property Price: $556,333
- Average Price per Square Foot: $237
- Days on Market: 75
- Number of Short Term Rental Comps: 325
- Monthly Short Term Rental Income: $4,321
- Short Term Rental Cash on Cash Return: 5.67%
- Short Term Rental Cap Rate: 5.74%
- Short Term Rental Daily Rate: $297
- Short Term Rental Occupancy Rate: 51%
- Walk Score: 40
56. Winooski, VT
- Median Property Price: $606,594
- Average Price per Square Foot: $254
- Days on Market: 143
- Number of Short Term Rental Comps: 181
- Monthly Short Term Rental Income: $4,795
- Short Term Rental Cash on Cash Return: 5.41%
- Short Term Rental Cap Rate: 5.47%
- Short Term Rental Daily Rate: $226
- Short Term Rental Occupancy Rate: 62%
- Walk Score: 83
57. Palmer, AK
- Median Property Price: $576,245
- Average Price per Square Foot: $236
- Days on Market: 84
- Number of Short Term Rental Comps: 160
- Monthly Short Term Rental Income: $4,985
- Short Term Rental Cash on Cash Return: 5.38%
- Short Term Rental Cap Rate: 5.42%
- Short Term Rental Daily Rate: $189
- Short Term Rental Occupancy Rate: 57%
- Walk Score: 2
58. Rapid City, SD
- Median Property Price: $529,448
- Average Price per Square Foot: $220
- Days on Market: 104
- Number of Short Term Rental Comps: 382
- Monthly Short Term Rental Income: $4,107
- Short Term Rental Cash on Cash Return: 5.32%
- Short Term Rental Cap Rate: 5.39%
- Short Term Rental Daily Rate: $200
- Short Term Rental Occupancy Rate: 62%
- Walk Score: 84
59. Keaau, HI
- Median Property Price: $651,162
- Average Price per Square Foot: $415
- Days on Market: 87
- Number of Short Term Rental Comps: 221
- Monthly Short Term Rental Income: $4,749
- Short Term Rental Cash on Cash Return: 5.22%
- Short Term Rental Cap Rate: 5.27%
- Short Term Rental Daily Rate: $191
- Short Term Rental Occupancy Rate: 59%
- Walk Score: 49
60. Brentwood, MD
- Median Property Price: $543,971
- Average Price per Square Foot: $319
- Days on Market: 51
- Number of Short Term Rental Comps: 103
- Monthly Short Term Rental Income: $4,732
- Short Term Rental Cash on Cash Return: 5.14%
- Short Term Rental Cap Rate: 5.19%
- Short Term Rental Daily Rate: $170
- Short Term Rental Occupancy Rate: 58%
- Walk Score: 66
61. Apalachicola, FL
- Median Property Price: $560,049
- Average Price per Square Foot: $268
- Days on Market: 74
- Number of Short Term Rental Comps: 109
- Monthly Short Term Rental Income: $4,189
- Short Term Rental Cash on Cash Return: 5.11%
- Short Term Rental Cap Rate: 5.17%
- Short Term Rental Daily Rate: $295
- Short Term Rental Occupancy Rate: 53%
- Walk Score: 60
62. Saint Augustine, FL
- Median Property Price: $533,150
- Average Price per Square Foot: $221
- Days on Market: 121
- Number of Short Term Rental Comps: 968
- Monthly Short Term Rental Income: $4,534
- Short Term Rental Cash on Cash Return: 5.05%
- Short Term Rental Cap Rate: 5.10%
- Short Term Rental Daily Rate: $222
- Short Term Rental Occupancy Rate: 53%
- Walk Score: 72
63. Goodyear, AZ
- Median Property Price: $531,123
- Average Price per Square Foot: $236
- Days on Market: 214
- Number of Short Term Rental Comps: 281
- Monthly Short Term Rental Income: $4,041
- Short Term Rental Cash on Cash Return: 4.99%
- Short Term Rental Cap Rate: 5.04%
- Short Term Rental Daily Rate: $295
- Short Term Rental Occupancy Rate: 52%
- Walk Score: 54
64. Fairhope, AL
- Median Property Price: $852,501
- Average Price per Square Foot: $335
- Days on Market: 95
- Number of Short Term Rental Comps: 155
- Monthly Short Term Rental Income: $4,747
- Short Term Rental Cash on Cash Return: 4.98%
- Short Term Rental Cap Rate: 5.03%
- Short Term Rental Daily Rate: $232
- Short Term Rental Occupancy Rate: 51%
- Walk Score: 79
65. Florida City, FL
- Median Property Price: $466,014
- Average Price per Square Foot: $295
- Days on Market: 97
- Number of Short Term Rental Comps: 100
- Monthly Short Term Rental Income: $4,228
- Short Term Rental Cash on Cash Return: 4.94%
- Short Term Rental Cap Rate: 4.99%
- Short Term Rental Daily Rate: $162
- Short Term Rental Occupancy Rate: 63%
- Walk Score: 67
66. Arcata, CA
- Median Property Price: $707,536
- Average Price per Square Foot: $389
- Number of Short Term Rental Comps: 129
- Monthly Short Term Rental Income: $4,517
- Short Term Rental Cash on Cash Return: 4.93%
- Short Term Rental Cap Rate: 4.98%
- Short Term Rental Daily Rate: $151
- Short Term Rental Occupancy Rate: 66%
- Walk Score: 92
67. Palm Harbor, FL
- Median Property Price: $491,726
- Average Price per Square Foot: $284
- Days on Market: 103
- Number of Short Term Rental Comps: 240
- Monthly Short Term Rental Income: $4,024
- Short Term Rental Cash on Cash Return: 4.92%
- Short Term Rental Cap Rate: 5.00%
- Short Term Rental Daily Rate: $238
- Short Term Rental Occupancy Rate: 60%
- Walk Score: 64
68. Davis, WV
- Median Property Price: $575,680
- Average Price per Square Foot: $247
- Days on Market: 186
- Number of Short Term Rental Comps: 201
- Monthly Short Term Rental Income: $4,036
- Short Term Rental Cash on Cash Return: 4.87%
- Short Term Rental Cap Rate: 4.93%
- Short Term Rental Daily Rate: $244
- Short Term Rental Occupancy Rate: 51%
- Walk Score: 0
69. Black Hawk, CO
- Median Property Price: $677,917
- Average Price per Square Foot: $376
- Days on Market: 84
- Number of Short Term Rental Comps: 109
- Monthly Short Term Rental Income: $4,606
- Short Term Rental Cash on Cash Return: 4.75%
- Short Term Rental Cap Rate: 4.79%
- Short Term Rental Daily Rate: $273
- Short Term Rental Occupancy Rate: 55%
- Walk Score: 14
70. Newburgh, NY
- Median Property Price: $514,985
- Average Price per Square Foot: $257
- Days on Market: 106
- Number of Short Term Rental Comps: 194
- Monthly Short Term Rental Income: $4,180
- Short Term Rental Cash on Cash Return: 4.66%
- Short Term Rental Cap Rate: 4.72%
- Short Term Rental Daily Rate: $206
- Short Term Rental Occupancy Rate: 51%
- Walk Score: 39
71. Hernando Beach, FL
- Median Property Price: $593,110
- Average Price per Square Foot: $355
- Days on Market: 114
- Number of Short Term Rental Comps: 183
- Monthly Short Term Rental Income: $4,154
- Short Term Rental Cash on Cash Return: 4.36%
- Short Term Rental Cap Rate: 4.40%
- Short Term Rental Daily Rate: $238
- Short Term Rental Occupancy Rate: 59%
- Walk Score: 1
72. Moab, UT
- Median Property Price: $625,000
- Average Price per Square Foot: $380
- Days on Market: 189
- Number of Short Term Rental Comps: 261
- Monthly Short Term Rental Income: $4,732
- Short Term Rental Cash on Cash Return: 4.36%
- Short Term Rental Cap Rate: 4.39%
- Short Term Rental Daily Rate: $244
- Short Term Rental Occupancy Rate: 54%
- Walk Score: 66
73. Alexandria, VA
- Median Property Price: $707,402
- Average Price per Square Foot: $438
- Days on Market: 33
- Number of Short Term Rental Comps: 462
- Monthly Short Term Rental Income: $4,728
- Short Term Rental Cash on Cash Return: 4.35%
- Short Term Rental Cap Rate: 4.40%
- Short Term Rental Daily Rate: $220
- Short Term Rental Occupancy Rate: 68%
- Walk Score: 67
74. Riverside, CA
- Median Property Price: $784,673
- Average Price per Square Foot: $415
- Days on Market: 57
- Number of Short Term Rental Comps: 211
- Monthly Short Term Rental Income: $4,992
- Short Term Rental Cash on Cash Return: 4.32%
- Short Term Rental Cap Rate: 4.35%
- Short Term Rental Daily Rate: $245
- Short Term Rental Occupancy Rate: 56%
- Walk Score: 37
75. Delray Beach, FL
- Median Property Price: $922,006
- Average Price per Square Foot: $402
- Days on Market: 97
- Number of Short Term Rental Comps: 517
- Monthly Short Term Rental Income: $4,349
- Short Term Rental Cash on Cash Return: 4.29%
- Short Term Rental Cap Rate: 4.37%
- Short Term Rental Daily Rate: $276
- Short Term Rental Occupancy Rate: 56%
- Walk Score: 94
2026 Best Short Term Rental Markets With $5,001+ Monthly Income
The median property prices in this section start at over $500,000, making it out of reach for many beginner investors. However, for those who can afford them, investing in these markets can give you some of the best dollar-for-dollar returns.
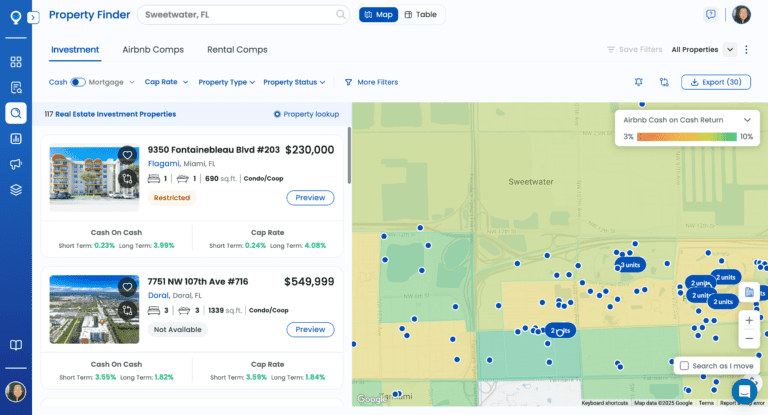
76. Sweetwater, FL
- Median Property Price: $506,738
- Average Price per Square Foot: $361
- Days on Market: 23
- Number of Short Term Rental Comps: 466
- Monthly Short Term Rental Income: $5,385
- Short Term Rental Cash on Cash Return: 7.43%
- Short Term Rental Cap Rate: 7.52%
- Short Term Rental Daily Rate: $194
- Short Term Rental Occupancy Rate: 70%
- Walk Score: 82
77. Hialeah Gardens, FL
- Median Property Price: $569,661
- Average Price per Square Foot: $357
- Days on Market: 271
- Number of Short Term Rental Comps: 313
- Monthly Short Term Rental Income: $5,258
- Short Term Rental Cash on Cash Return: 6.85%
- Short Term Rental Cap Rate: 6.93%
- Short Term Rental Daily Rate: $166
- Short Term Rental Occupancy Rate: 67%
- Walk Score: 66
78. Winnetka, CA
- Median Property Price: $896,088
- Average Price per Square Foot: $531
- Days on Market: 63
- Number of Short Term Rental Comps: 330
- Monthly Short Term Rental Income: $8,661
- Short Term Rental Cash on Cash Return: 6.57%
- Short Term Rental Cap Rate: 6.62%
- Short Term Rental Daily Rate: $322
- Short Term Rental Occupancy Rate: 81%
- Walk Score: 74
79. Waianae, HI
- Median Property Price: $831,163
- Average Price per Square Foot: $573
- Days on Market: 133
- Number of Short Term Rental Comps: 283
- Monthly Short Term Rental Income: $5,334
- Short Term Rental Cash on Cash Return: 6.28%
- Short Term Rental Cap Rate: 6.37%
- Short Term Rental Daily Rate: $544
- Short Term Rental Occupancy Rate: 66%
- Walk Score: 19
80. Big Coppitt, FL
- Median Property Price: $959,000
- Average Price per Square Foot: $756
- Number of Short Term Rental Comps: 190
- Monthly Short Term Rental Income: $8,083
- Short Term Rental Cash on Cash Return: 6.27%
- Short Term Rental Cap Rate: 6.31%
- Short Term Rental Daily Rate: $399
- Short Term Rental Occupancy Rate: 72%
- Walk Score: 26
81. Madison, WI
- Median Property Price: $628,150
- Average Price per Square Foot: $360
- Number of Short Term Rental Comps: 189
- Monthly Short Term Rental Income: $5,584
- Short Term Rental Cash on Cash Return: 5.46%
- Short Term Rental Cap Rate: 5.51%
- Short Term Rental Daily Rate: $303
- Short Term Rental Occupancy Rate: 63%
- Walk Score: 45
82. Peabody, MA
- Median Property Price: $689,554
- Average Price per Square Foot: $388
- Days on Market: 35
- Number of Short Term Rental Comps: 260
- Monthly Short Term Rental Income: $5,838
- Short Term Rental Cash on Cash Return: 5.22%
- Short Term Rental Cap Rate: 5.26%
- Short Term Rental Daily Rate: $314
- Short Term Rental Occupancy Rate: 55%
- Walk Score: 88
83. South Portland, ME
- Median Property Price: $691,387
- Average Price per Square Foot: $457
- Days on Market: 152
- Number of Short Term Rental Comps: 574
- Monthly Short Term Rental Income: $5,663
- Short Term Rental Cash on Cash Return: 5.19%
- Short Term Rental Cap Rate: 5.24%
- Short Term Rental Daily Rate: $289
- Short Term Rental Occupancy Rate: 60%
- Walk Score: 67
84. Bloomfield, NJ
- Median Property Price: $637,980
- Days on Market: 40
- Number of Short Term Rental Comps: 216
- Monthly Short Term Rental Income: $5,493
- Short Term Rental Cash on Cash Return: 5.04%
- Short Term Rental Cap Rate: 5.09%
- Short Term Rental Daily Rate: $170
- Short Term Rental Occupancy Rate: 51%
- Walk Score: 70
85. Sister Bay, WI
- Median Property Price: $789,950
- Average Price per Square Foot: $367
- Days on Market: 75
- Number of Short Term Rental Comps: 127
- Monthly Short Term Rental Income: $5,987
- Short Term Rental Cash on Cash Return: 5.02%
- Short Term Rental Cap Rate: 5.07%
- Short Term Rental Daily Rate: $386
- Short Term Rental Occupancy Rate: 52%
- Walk Score: 48
86. Wilmington, CA
- Median Property Price: $739,659
- Average Price per Square Foot: $531
- Days on Market: 91
- Number of Short Term Rental Comps: 234
- Monthly Short Term Rental Income: $5,611
- Short Term Rental Cash on Cash Return: 5.01%
- Short Term Rental Cap Rate: 5.05%
- Short Term Rental Daily Rate: $177
- Short Term Rental Occupancy Rate: 84%
- Walk Score: 90
87. Reseda, CA
- Median Property Price: $847,449
- Average Price per Square Foot: $574
- Days on Market: 59
- Number of Short Term Rental Comps: 302
- Monthly Short Term Rental Income: $6,679
- Short Term Rental Cash on Cash Return: 5.00%
- Short Term Rental Cap Rate: 5.04%
- Short Term Rental Daily Rate: $331
- Short Term Rental Occupancy Rate: 65%
- Walk Score: 88
88. Ithaca, NY
- Median Property Price: $831,141
- Average Price per Square Foot: $282
- Days on Market: 282
- Number of Short Term Rental Comps: 208
- Monthly Short Term Rental Income: $5,918
- Short Term Rental Cash on Cash Return: 5.00%
- Short Term Rental Cap Rate: 5.06%
- Short Term Rental Daily Rate: $327
- Short Term Rental Occupancy Rate: 52%
- Walk Score: 10
89. University Park, FL
- Median Property Price: $850,522
- Average Price per Square Foot: $430
- Days on Market: 5
- Number of Short Term Rental Comps: 381
- Monthly Short Term Rental Income: $6,120
- Short Term Rental Cash on Cash Return: 4.84%
- Short Term Rental Cap Rate: 4.88%
- Short Term Rental Daily Rate: $218
- Short Term Rental Occupancy Rate: 68%
- Walk Score: 69
90. Hilo, HI
- Median Property Price: $776,012
- Average Price per Square Foot: $438
- Days on Market: 96
- Number of Short Term Rental Comps: 263
- Monthly Short Term Rental Income: $5,529
- Short Term Rental Cash on Cash Return: 4.82%
- Short Term Rental Cap Rate: 4.86%
- Short Term Rental Daily Rate: $190
- Short Term Rental Occupancy Rate: 59%
- Walk Score: 19
91. Wilton Manors, FL
- Median Property Price: $850,896
- Average Price per Square Foot: $507
- Days on Market: 107
- Number of Short Term Rental Comps: 334
- Monthly Short Term Rental Income: $6,488
- Short Term Rental Cash on Cash Return: 4.68%
- Short Term Rental Cap Rate: 4.73%
- Short Term Rental Daily Rate: $235
- Short Term Rental Occupancy Rate: 74%
- Walk Score: 76
92. Ponte Vedra, FL
- Median Property Price: $830,311
- Average Price per Square Foot: $325
- Days on Market: 122
- Number of Short Term Rental Comps: 204
- Monthly Short Term Rental Income: $5,971
- Short Term Rental Cash on Cash Return: 4.61%
- Short Term Rental Cap Rate: 4.65%
- Short Term Rental Daily Rate: $309
- Short Term Rental Occupancy Rate: 56%
- Walk Score: 41
93. Nags Head, NC
- Median Property Price: $775,975
- Average Price per Square Foot: $420
- Days on Market: 95
- Number of Short Term Rental Comps: 398
- Monthly Short Term Rental Income: $5,177
- Short Term Rental Cash on Cash Return: 4.51%
- Short Term Rental Cap Rate: 4.55%
- Short Term Rental Daily Rate: $328
- Short Term Rental Occupancy Rate: 53%
- Walk Score: 38
94. Grover Beach, CA
- Median Property Price: $747,220
- Average Price per Square Foot: $645
- Days on Market: 37
- Number of Short Term Rental Comps: 186
- Monthly Short Term Rental Income: $5,362
- Short Term Rental Cash on Cash Return: 4.49%
- Short Term Rental Cap Rate: 4.52%
- Short Term Rental Daily Rate: $304
- Short Term Rental Occupancy Rate: 62
- Walk Score: 90
95. Walnut Creek, CA
- Median Property Price: $843,754
- Average Price per Square Foot: $577
- Days on Market: 46
- Number of Short Term Rental Comps: 150
- Monthly Short Term Rental Income: $5,188
- Short Term Rental Cash on Cash Return: 4.43%
- Short Term Rental Cap Rate: 4.48%
- Short Term Rental Daily Rate: $167
- Short Term Rental Occupancy Rate: 85%
- Walk Score: 67
96. Fernandina Beach, FL
- Median Property Price: $987,306
- Average Price per Square Foot: $460
- Days on Market: 86
- Number of Short Term Rental Comps: 341
- Monthly Short Term Rental Income: $5,953
- Short Term Rental Cash on Cash Return: 4.28%
- Short Term Rental Cap Rate: 4.31%
- Short Term Rental Daily Rate: $285
- Short Term Rental Occupancy Rate: 61%
- Walk Score: 75
97. Doral, FL
- Median Property Price: $688,831
- Average Price per Square Foot: $405
- Days on Market: 143
- Number of Short Term Rental Comps: 160
- Monthly Short Term Rental Income: $5,228
- Short Term Rental Cash on Cash Return: 4.19%
- Short Term Rental Cap Rate: 4.24%
- Short Term Rental Daily Rate: $174
- Short Term Rental Occupancy Rate: 67%
- Walk Score: 17
98. Kendall, FL
- Median Property Price: $843,309
- Average Price per Square Foot: $376
- Days on Market: 5
- Number of Short Term Rental Comps: 227
- Monthly Short Term Rental Income: $5,647
- Short Term Rental Cash on Cash Return: 4.14%
- Short Term Rental Cap Rate: .18%
- Short Term Rental Daily Rate: $248
- Short Term Rental Occupancy Rate: 63%
- Walk Score: 22
99. Wells, ME
- Median Property Price: $827,707
- Average Price per Square Foot: $497
- Days on Market: 88
- Number of Short Term Rental Comps: 212
- Monthly Short Term Rental Income: $5,183
- Short Term Rental Cash on Cash Return: 4.03%
- Short Term Rental Cap Rate: 4.07%
- Short Term Rental Daily Rate: $331
- Short Term Rental Occupancy Rate: 52%
- Walk Score: 52
100. South Burlington, VT
- Median Property Price: $664,144
- Average Price per Square Foot: $280
- Days on Market: 58
- Number of Short Term Rental Comps: 323
- Monthly Short Term Rental Income: $5,291
- Short Term Rental Cash on Cash Return: 3.92%
- Short Term Rental Cap Rate: 3.96%
- Short Term Rental Daily Rate: $235
- Short Term Rental Occupancy Rate: 55%
- Walk Score: 70
How to Find the Best Short Term Rental Investments

We hope this list of the best short term rental markets helps you start your search. But remember, this is only the beginning.
Aside from making sure that short term rental homes are legal in the location you are interested in, you must also search for a house that will earn you a positive cash flow. Successful real estate investors make wise investment decisions based on complex data that comes from reliable sources.
When looking for the best short term rental markets in 2026, you need to consider the following:
- Reasons to visit: Why are people traveling to a specific destination? Is it for business or leisure purposes?
- Profit potential: How much would you earn if you invested in a short term rental property in that area?
Finding out why people are going to a city is easy. On the other hand, determining a market’s profit potential involves more in-depth research. You could visit the area yourself, check out every active short term rental property, and consult with a local real estate agent. A more efficient method, however, would be to use a real estate investment platform like Mashvisor.
Mashvisor specializes in analyzing the profitability of properties for sale across the US, including Texas, Georgia, Illinois, Virginia, and many other locations best for rental property investing.
We collate real estate data from the best publicly available sources, such as the MLS, Airbnb, and public records, regularly to provide up-to-date analysis to investors like you.
Our machine-learning algorithms then apply this data to give you a readily available analysis that is easy to understand. Thus, researching investment properties will only take a few minutes.
5 Ways to Find Profitable Real Estate Investments Using Mashvisor
When searching for a rental home using our platform, you can take advantage of the following features:
- Market Finder: This tool gives you a bird’s-eye view of different markets in the country and shows you what each one offers. It is handy and a time saver when checking out states with many listings.
- Real Estate Heatmap: If you are looking for the best short term rental markets in Florida, for example, our heatmap will help you find them faster. This tool shows you which parts of a city have the highest or lowest cash on cash returns, rental income, listing price, or occupancy rate.
- Property Finder: This feature allows you to search up to 10 cities concurrently without opening more tabs on your browser. It displays all of the properties in these areas, and you can narrow down your search further by setting filters like budget, rental strategy, property types, and more.
- Analytics: Once you find a house that interests you, click it to open its listing page. There, you will find the house’s information and description, as well as our profitability analysis of the property and its neighborhood.
- Short Term Rental Calculator: The profit calculator, which shows your cash flow and investment payback based on the estimated monthly income and expenses, is also included on the listing page. You can also edit some of the numbers to calculate more accurately based on your specific situation.
Grow Your Vacation Rental Business in One of the Best Short Term Rental Markets
The short term rental industry in the US continues to show signs of growth in 2026. So if you’ve been aspiring to start your own short term rental business, now is the best time to get into it. All you need is a reliable tool like Mashvisor to help you find a lucrative property that you can rent out. Its different features will definitely help you find the best possible deals in the most profitable markets of your choice.
But what if you’re already managing one or more vacation rental properties and want to increase your profits this year? Mashvisor can help you with this as well. Mashvisor now has a vacation rental software to make your operations run smoothly and efficiently. Its features include:
- Vacation rental channel manager: Link your accounts on different booking platforms, such as Airbnb, Booking.com, Vrbo, and more, with Mashvisor so you can sync your listings across all these accounts and prevent double bookings. There’s no need to log into each website every time.
- Unified inbox: Messages you receive on your linked accounts will also be synced with your Mashvisor inbox, so you can view all of your correspondence and send messages from one platform.
- Multi-calendar: Mashvisor’s multi-calendar gives you a quick overview of all your listings so you know which property is booked on what date and at what price.
- More features coming soon!