One of the best ways to invest in real estate is to buy short-term rental properties. Generally, vacation rentals will generate higher rental income than long-term rentals. However, if you want to maximize your potential returns, you have to run the numbers before you invest.
One metric commonly used in the short-term rental market to measure how well a vacation rental performs relative to other properties is the average Airbnb daily rate (ADR). In this blog, we’ll take a deep dive into the ADR. Keep reading to learn more about this key metric and how you can use it to make better investment decisions.
Related: Four Things to Consider Before Purchasing an Airbnb Investment Property
What Is Average Daily Rate (ADR)?
The average daily rate is the average price that a vacation rental property is booked for in a given period of time. In other words, the average Airbnb daily rate shows, on average, how much an Airbnb host makes in a given day. The higher the average Airbnb daily rate, the better.
If the ADR is going up over time, it shows that the vacation rental is generating more revenue. By measuring the current ADR against the historical ADR of the vacation rental property, you can look at the trend and determine it’s operating performance.
How to Calculate Average Daily Rate (ADR)
The average Airbnb daily rate is calculated by dividing the total Airbnb rental income earned for a certain period by the number of booked nights.
ADR = Total Rental Income/Number of Booked Nights
Example:
If a vacation rental property generates $30,000 in rental income and it is booked for 300 nights during that period, the average Airbnb daily rate would be:
ADR = $30,000/300 nights = $100.
How to Use the Average Airbnb Daily Rate
Average Airbnb daily rate is a standard metric used to gauge potential revenues. It’s a better performance indicator than the nightly rate because it shows the actual rental price that Airbnb guests are paying and not just the rental prices that hosts are advertising. There are three ways to use this metric during your analysis:
Finding the Best Airbnb Markets
ADR is one of the most crucial Airbnb metrics used to analyze Airbnb markets. So when choosing a location, one step is to compare average Airbnb daily rates. Short-listing a few real estate markets where hosts earn a high daily rate on average is a great way to narrow down your choices quickly.
Finding the Best Airbnb Investment Properties for Sale
Having the ADR data for vacation rentals for sale will help you compare properties and choose one that will make you a lot of money. It’s a key metric that you should be looking at during your investment property analysis.
Deciding How Much to Charge for Rent
If you want to beat the competition and attract bookings, you must know how much to charge for rent. Merely listing your vacation rental on Airbnb isn’t enough to attract guests and generate revenue.
You need to have an effective Airbnb pricing strategy and analyzing ADR is a good way to achieve it. Analyzing the average Airbnb daily rate of vacation rentals in your target area will help you set a competitive nightly rate.
But Be Sure Not to Make All Your Decisions Based on This One Number
While the average Airbnb daily rate provides hosts with valuable insight, it’s not sufficient for measuring the overall performance of an Airbnb rental property or housing market. It should not be used in isolation.
As a real estate investor, you need to also factor in the Airbnb occupancy rate to make a sound judgment on performance. It’s also a good idea to look at numbers like cash flow, cash on cash return, and cap rate.
Where Can You Find Average Airbnb Daily Rate Data?
Mashvisor is the best real estate investment software for Airbnb analytics. Using Mashvisor is the fastest way to perform your market research and Airbnb investment analysis.
You can find Airbnb statistics by city on Mashvisor’s real estate blog. This includes Airbnb data such as average Airbnb daily rate, Airbnb occupancy rate, Airbnb rental income, Airbnb cash on cash return, and Airbnb cap rate.
To give you a taste of the data typically found on Mashvisor’s blog, here are some of the top cities in the US ranked by average Airbnb daily rate:
20 Cities with the Highest Average Airbnb Daily Rate in the US Housing Market
- Key West, FL: $761
- Tuscaloosa, AL: $510
- Islip, NY: $408
- Mashpee, MA: $381
- Cathedral City, CA: $374
- Miami Beach, FL: $328
- Fort Lauderdale, FL: $298
- Santa Barbara, CA: $297
- Corona, CA: $287
- North Miami, FL: $284
- Oxnard, CA: $283
- DeSoto, TX: $280
- Green Bay, WI: $275
- Honolulu, HI: $274
- Bryan, TX: $272
- Virginia Beach, VA: $270
- Boulder, CO: $270
- San Francisco, CA: $268
- Charlottesville, VA: $266
- Santa Fe, NM: $265
You can also use Mashvisor’s average daily rate calculator to get accurate estimates of the average Airbnb daily rate for individual investment properties for sale in your housing market of choice. With the ADR calculator, you don’t need to use an Airbnb spreadsheet for your investment analysis. Apart from being prone to error, using a spreadsheet to analyze Airbnb investments can be time-consuming.
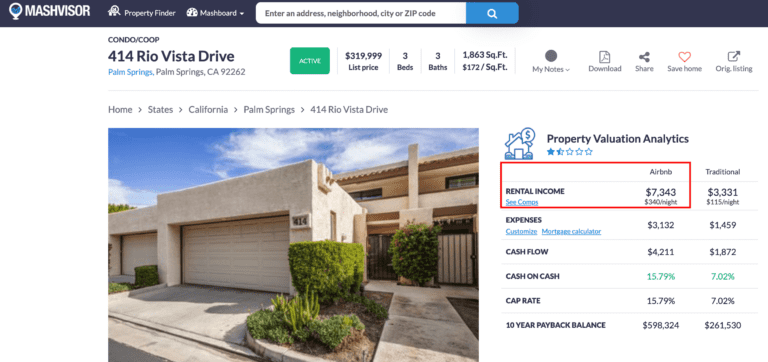
See how Mashvisor’s Airbnb daily rate calculator projects the value for a Palm Springs investment property for sale.
The Bottom Line
The average Airbnb daily rate is one of the most important metrics when analyzing short-term rental markets and investment properties for sale. However, to accurately measure performance using this metric, it should be used along with other key Airbnb investment metrics. All the metrics and data you’ll ever need for analyzing an Airbnb rental property can be found on Mashvisor.
If you’re ready to invest in short term rentals in the area of your choice, make sure to use the best real estate platform available. Sign up for a 7-day free trial of Mashvisor now, followed by 15% off for life.