As we head towards the new year, real estate investors are looking for the best Airbnb analytics platform to augment and enhance their property decisions.
Table of Contents
- Airbnb Analysis Platform to Use at the Neighborhood Level
- Airbnb Analytics Platform to Use at the Property Level
- Airbnb Data Source
- Which Is Better—AirDNA or Mashvisor—as an Airbnb Analytics Platform?
Despite the uncertainties of the US residential market over the past couple of years, in 2022, Airbnb properties emerged as the best among the many real estate investment strategies. Notably, experts expect the trend to continue next year in their US housing market predictions.
So, the question that both beginner and experienced investors face is: “How do I find profitable vacation rental homes in top locations?”
The answer is: With the help of the best Airbnb analytics software for this year—Mashvisor.
In recent years, the short term rental industry has been revolutionized by the spread of technology and predictive analytics. Currently, access to reliable Airbnb data and AI-driven analytical tools equals power and profitability in the vacation rental business. In other words, investors cannot outperform the competition without using a top platform.
However, using just any Airbnb data analytics platform will not do the trick. Instead, Airbnb hosts need to make sure that they use the top option available on the market.
In this article, we will explain why our real estate investment app is the best Airbnb analytics platform in the US market. To do so, we will show you the type of Airbnb data and analysis you can obtain and why it is important for making lucrative real estate investing decisions.
Airbnb Analysis Platform to Use at the Neighborhood Level
If you’ve done any real estate research and studying, you will have noticed the one word every expert keeps repeating: LOCATION.
Whether you are investing in traditional, long term rentals or Airbnb, short term rental properties, the real estate market is a major determinant of your return on investment. It refers to both the city and neighborhood where you buy and own an income property.
The reason is that the location determines property prices, closing costs, startup expenses, Airbnb daily rates, rental income, Airbnb occupancy rate, recurring expenses, and cash flow. In turn, all these analytics factor in the formulas for the rate of return, whether you look at cash on cash return or cap rate.
Most importantly, while you can change almost anything about your Airbnb rental property – finishings, furnishing, amenities, etc. – location is the one thing that remains constant. So, you must pay special attention to it when learning how to buy Airbnb property.
We at Mashvisor are well aware of this fact. Similarly, we realize that it is impossible for beginner and part-time real estate investors to perform real estate market analysis at the level and speed of experienced professionals.
In order to accelerate the analysis, we’ve developed a couple of real estate investment tools that allow Airbnb hosts to conduct neighborhood analysis quickly and efficiently. Our Airbnb analytics platform hosting such tools helps new investors choose the best area when buying a vacation home this year and beyond.
Neighborhood Airbnb Heatmap
The first real estate investing app tool to help analyze the Airbnb potential of areas is Mashvisor’s heatmap.
Generally speaking, a real estate heatmap is a color-coded visual representation of the neighborhoods within a certain market based on a number of different criteria. Our heatmap uses light blue to mark areas with low values and dark blue for areas with high values.
With regards to investing in Airbnb income properties, investors can search for neighborhoods in any US city or town through the following filters:
- Listing price: Investing in affordable short term rental properties is crucial, especially for beginners with limited financial resources and alternative financing methods. You want to avoid foreclosure.
- Airbnb rental income: How much Airbnb revenue you are able to generate monthly is one of the analytics determining your overall profitability. It is the difference between positive and negative cash flow.
- Airbnb occupancy rate: Combined with the Airbnb daily rate, your occupancy rate makes up your monthly rental income. You don’t want to invest in a region where Airbnb demand is weak.
- Airbnb cash on cash (CoC) return: The CoC return is the most important metric of return on investment in the vacation rental industry. It shows the profit you are making, taking into consideration financing.
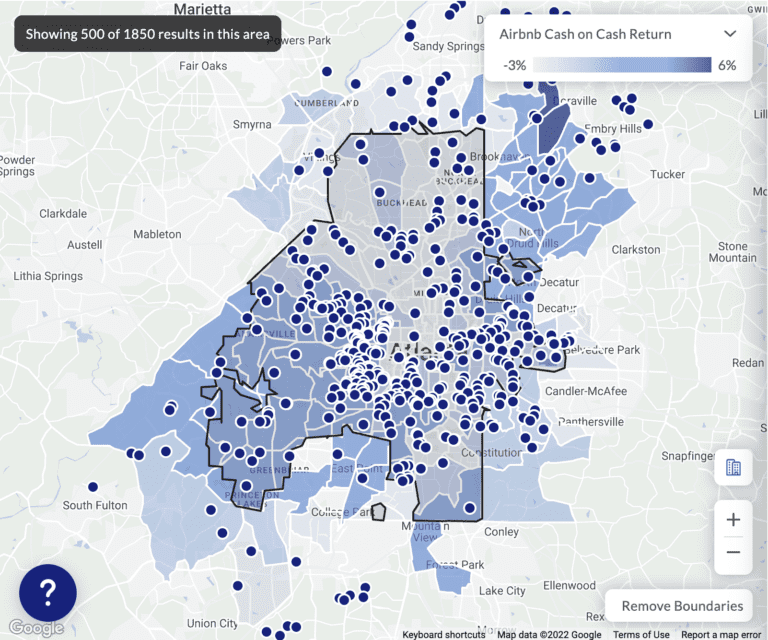
Mashvisor’s Heatmap Neighborhood Analysis of Airbnb Cash on Cash Return in the Atlanta Real Estate Market
Related: Airbnb Rentals: Finding Income Properties Using a Heatmap
The heatmap available on the best Airbnb data analytics platform helps you focus your Airbnb investment property search on areas that meet your requirements. That is, you can find neighborhoods with home values within your budget and high enough Airbnb income and Airbnb occupancy rate to result in an above-average rate of return.
Airbnb Neighborhood Analytics Pages
Identifying a few potentially good neighborhoods for buying short term rental properties with our Airbnb analytics platform heatmap is the first step. Afterward, an investor can conduct detailed neighborhood analysis with Mashvisor’s neighborhood analytics pages.
Our real estate investment software platform provides the following Airbnb data for all neighborhoods in any US housing market, no matter how big or small:
- Mashmeter score
- Median property price
- Average price per square foot
- Average Airbnb cash on cash return
- Average Airbnb rental income
- Number of investment properties for sale
- Number of Airbnb listings
- Average Airbnb occupancy rate
- Optimal property type: Single family home, condo, apartment, townhouse, multifamily home, guest house, guest suite, etc.
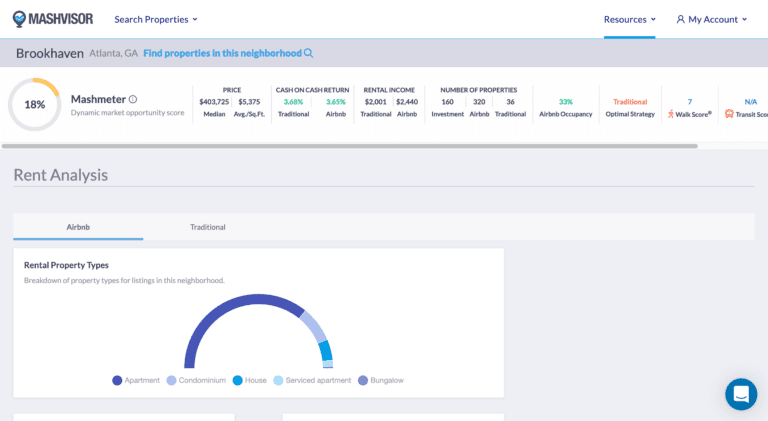
Mashvisor’s Neighborhood Analysis Page
It’s clear how knowing the Airbnb income, Airbnb occupancy rate, and Airbnb cash on cash return in a rental market will help hosts identify the best places for buying a vacation home. However, the rest of the Airbnb analytics are also quite important.
For example, an area with a large number of rental properties for sale is probably currently a buyer’s market. It means that even new real estate investors can enter without engaging in a bidding war with homebuyers and more experienced investors.
Similarly, the number of Airbnb rentals is an excellent indicator of the demand for and the supply of vacation homes in the neighborhood. The best property type and number of bedrooms in the ideal income property allow investors to narrow down their property search to listings with these characteristics.
All the above Airbnb data details come together to complete the neighborhood analysis for buying Airbnb investment properties through our analytics platform.
Airbnb Analytics Platform to Use at the Property Level
As you can imagine, investing in a profitable rental property is not limited to only choosing a good housing market. Conducting meaningful Airbnb investment property searches and analyzing the potential of individual properties are equally important.
That’s why the best Airbnb analytics platform must provide customized property search options and detailed rental property analysis. And Mashvisor’s Property Finder, investment property search engine, and Airbnb investment calculator do exactly that.
With the help of our Property Finder and property search engine, you can find MLS listings and off market properties that match your exact investor requirements. You can find available short term rentals for sale based on your location, budget, expected income, and required profitability.
Our Airbnb profit calculator, meanwhile, allows you to conduct investment property analysis on any residential property in the US market to evaluate how it would perform on Airbnb.
With the help of our Airbnb analytics platform, you don’t need to guess what return you can generate from a property before buying it. This year, you can make confident investments instead.
Here is the type of Airbnb data and information that you can expect to find for every single vacation rental available on our platform:
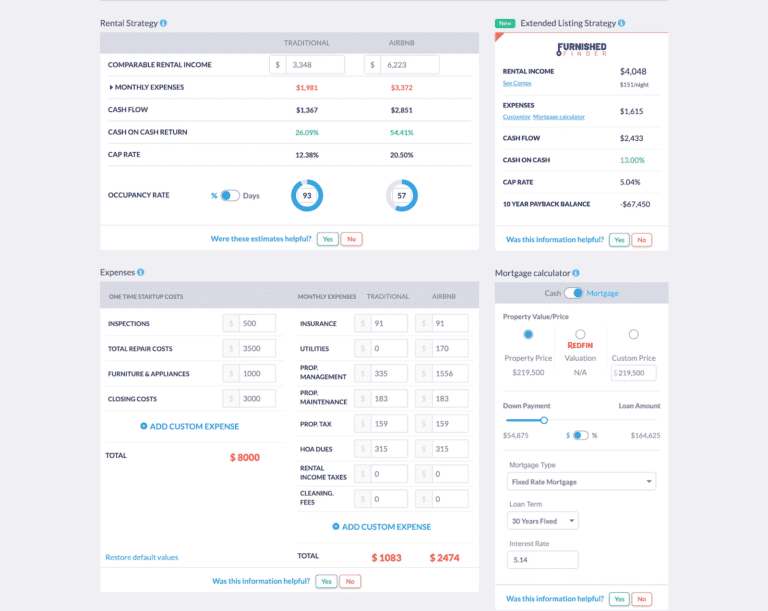
Mashvisor’s Investment Property Calculator: Analysis of an Airbnb Atlanta Rental Property
Airbnb Rental Income
When conducting real estate investment analysis, one of the first figures on which experts focus is rental income. The same holds true for investing in short term rental properties. How much money you can expect to make per month will eventually determine whether you end up with positive or negative cash flow properties and what rate of return you generate.
In vacation home investing, the Airbnb income is the product of the nightly rate and the Airbnb occupancy rate. Traditionally, when choosing a property to buy, investors looked for Airbnb comps in their area of choice, obtain data, and calculate the comparable income of hundreds of active listings.
However, an Airbnb income calculator provides you with the expected monthly rate for any property right away. In this way, using an Airbnb data platform speeds up your investment decision-making process and ensures you get access to the hottest deals on the market.
Airbnb Occupancy Rate
As already mentioned, the number of days in a month or a year for which you manage to get your short term rental booked is one of the two most important factors for profitability. The occupancy data is also readily available on our app.
Mashvisor’s Airbnb data platform calculates the Airbnb occupancy rate as the average ratio between the number of bookings and the number of available days for booking. It eliminates the owner’s personal use of the property, making the estimate more accurate. We consider all comparable Airbnb listings in the area over the past 12 months when doing the calculation.
Of course, that’s just an estimate. If you believe you can enhance your bookings by putting in extra marketing efforts, you can always change the number in the rental property analysis. Our highly interactive and customizable platform will automatically redo all calculations and provide you with new estimates of Airbnb income and return on investment.
Related: Where Can You Find Airbnb Occupancy Rate Data for Real Estate Investing?
Airbnb Cash on Cash Return
Investors go for real estate in order to make money, and the way to make money with rental properties is to achieve a good cash on cash return. Calculating the expected CoC return on hundreds of investment properties for sale in order to choose the most profitable one requires tons of time and effort. And part-time investors simply lack such a capacity.
That’s why they should trust the best Airbnb investment analysis app with the calculations. When checking what Airbnb cash on cash return to expect on a certain property, don’t forget to choose the financing method (cash vs. mortgage) most appropriate for you. Our platform will immediately recalculate all values based on how you pay for your vacation rental property.
If you’re looking for the locations with the highest Airbnb CoC return at the moment, check out the 100 best short term rental markets.
Airbnb Cap Rate
Successful real estate investors don’t limit themselves to the CoC return only but also calculate cap rate. Using traditional methods to analyze Airbnb properties further complicates the rental property analysis process. It also increases the risk of someone else closing all profitable deals before you.
The good news is that our Airbnb data analytics platform eliminates the said risk – as well as the risk of human error during manual calculations – by acting as an Airbnb cap rate calculator too.
Here, you can check out what Airbnb cap rate by city you can expect in the US market this year.
Recurring Monthly Expenses
To provide all the above-listed metrics of rate of return on a rental property, it’s not enough to know what income a vacation home can generate per month.
Mashvisor’s Airbnb profitability calculator also needs to calculate how much it costs to own, manage, and run a short term rental property in a specific real estate market. Thus, our platform includes the following costs in the real estate analysis of Airbnb for sale:
- Property tax
- Property insurance
- Airbnb rental income tax
- HOA dues (if investing in a condo or another similar property type)
- Property maintenance
- Property management
- Cleaning fees
- Utilities
All the above costs are customizable if you strongly believe yours will differ significantly. Moreover, you can add other expenses that might be applicable to your investment strategy.
Cash Flow
Investing in positive cash flow income properties is a must as that’s the way to make – rather than lose – money from real estate. Cash flow is simply the difference between the Airbnb income and monthly rental expenses. But it takes a lot of Airbnb data to calculate the cash flow, especially if you’re analyzing a few dozen properties for sale.
No worries; once again, Mashvisor’s Airbnb investment property calculator provides the cash flow metric right away. There’s no need to conduct manual Airbnb market research and collect short term rental comps data.
Related: Rental Comps: What Are They and Where Can I FInd Them?
Property Price
The sale price of an income property is important for two main reasons.
First of all, it determines whether a real estate listing is within your budget as an investor or not. With an annual real estate appreciation of 16.5% at the moment, a home’s value is becoming more important than ever.
So, before starting to search for and analyze rental properties, you should calculate your savings, income, and expenses and decide exactly how much you can afford to pay.
Then, you need to stick to your investment property budget to avoid a default on your mortgage payments and foreclosure. That’s the last thing you want as an Airbnb host (or a landlord, for that matter).
Second, the property price is factored in all measures of return on investment, including the Airbnb cap rate and the Airbnb cash on cash return. When it comes to the CoC return, it is included in the size of the down payment, as well as the monthly mortgage payment amounts.
The Mashvisor Airbnb analytics platform provides the expected purchase price based on the MLS listing information and the Redfin estimate. Then, it uses the said price to calculate the down payment, monthly mortgage payments, and other analytics.
One-Time Startup Costs
Don’t forget that the sale price is not the only cost you incur when buying rental properties, including a vacation home. There is a whole array of additional initial expenses depending on your financing method, such as:
- Home inspection fees
- Closing fees, including real estate appraisal fees
- Repairs
- Furniture (which can amount to a lot when you invest in Airbnb)
The best Airbnb data analytics platform is sure to provide reliable and accurate estimates of all the relevant expenses – both for MLS listings and off market properties. Meanwhile, the numbers remain customizable so that you can fit your rental property analysis to your unique investment situation.
Airbnb Rental Comps
For smart real estate investors buying Airbnb income properties, it is important to understand where all estimates and forecasts come from. It holds true even if they don’t conduct the Airbnb investment property analysis themselves but instead use a platform.
That’s why Mashvisor’s real estate investment app provides a list of all Airbnb listings in the area that are similar to the property that you’re considering buying. The similar features include the property type, number of bedrooms and bathrooms, amenities, and other characteristics.
They are known as Airbnb rental comparables or rental comps. They are the actual listings on the Airbnb platform that our tools use to perform all analysis. As an investor, you can access them through our app or download them as a CSV file to analyze on your own or share with your real estate network.
Financing Method
Our Airbnb analytics platform acts as a mortgage calculator as well. Very few lucky real estate investors are capable of buying rental properties in cash. That’s why the majority resort to taking a mortgage loan.
When purchasing a property with a loan, the size of the down payment, the loan type, the loan term, and the interest rate all affect the performance of a short term rental property. The loan details are particularly important when calculating the return on investment in terms of cash on cash return.
Airbnb Data Source
The real estate data included in our Airbnb neighborhood and investment property analysis comes from two main sources: the MLS and the Airbnb platform. It means that our calculations and estimates reflect the following:
- Actual real estate listings with regard to property prices
- Actual Airbnb rental listings in terms of daily rates, occupancy rate, and all other consequent metrics
Furthermore, our Data Team constantly assures the accuracy of the data and analysis provided by our Airbnb analytics platform. It is done by comparing our estimates to the results of real Airbnb hosts in each area.
Savvy investors are probably wondering, “Does Airbnb provide data?”
The answer is: No, Airbnb does not provide easily accessible and digestible data to individual investors.
That’s why it’s a smart move to use a short term rental analytics platform that collects, organizes, cleans, and analyzes the data on your behalf.
Which Is Better—AirDNA or Mashvisor—as an Airbnb Analytics Platform?
Anyone who’s spent some time in the vacation rental investing space has probably heard the name AirDNA. That’s because it is one of the most popular apps for analyzing the performance of short term rental properties. However, being popular doesn’t automatically make AirDNA the best Airbnb data analysis platform.
A simple comparison between Mashvisor vs AirDNA reveals that the former is the superior tool for finding and analyzing Airbnb investment properties for sale.
To begin with, Mashvisor provides the ability to search for available listings for sale, while investors need to bring their own properties to analyze with the AirDNA platform.
Second, Mashvisor offers a much wider range of Airbnb data points, which help hosts make better-informed decisions, considering more factors.
Last but not least, Mashvisor supplies side-by-side investment analysis of properties when rented out on Airbnb vs traditionally. It means that if you ever decide to switch between rental strategies, our platform will have you covered.
Related: AirDNA vs Mashvisor: Which One Is the Better Source of Airbnb Data?
Final Words: Getting Started With the Best Airbnb Data Analytics Platform
Access to the best Airbnb analytics platform is a must when purchasing short term rental properties. With all the competition out there, beginner investors stand no chance of profit unless they use all the data and analysis they can get a hold of.
Among the dozens of tools that claim to help investors make better vacation rental investing decisions, Mashvisor is the top choice. The reason is that our app helps choose both the best area and the best property to invest in.
Furthermore, all real estate and rental data comes from reliable, verifiable sources. In addition, we present the Airbnb data analytics in a way that makes them accessible and comprehensible for even beginners with no previous knowledge of real estate investing.
But don’t take our word for it. Sign up for a free 7-day trial of Mashvisor now to start analyzing neighborhoods and Airbnb rental properties for sale.