Webster Investment Analysis
Investment Property in Webster, MA

Webster, MA Real Estate Investment Performance
$ 425,000
Median
1,983
Avg/Sq.ft.
2.00%
Traditional
4.00%
Airbnb
$ 2,650
Traditional
$ 4,960
Airbnb
$ 2,650
Traditional
$ 4,960
Airbnb
1
Investment
17
Airbnb
7
Traditional
66%
Airbnb occupancy rate
Webster, MA Properties Rental Prices
| RENTAL STRATEGY | 1 ROOM | 2 ROOMS | 3 ROOMS | 4 ROOMS |
|---|---|---|---|---|
| Airbnb | $ 3,163 | $ 3,895 | $ 6,373 | $ 4,960 |
| Traditional | $ 1,186 | $ 1,406 | $ 1,722 | $ 2,041 |
| 1 ROOM | $ 3,163 |
|---|---|
| 2 ROOMS | $ 3,895 |
| 3 ROOMS | $ 6,373 |
| 4 ROOMS | $ 4,960 |
| 1 ROOM | $ 1,186 |
|---|---|
| 2 ROOMS | $ 1,406 |
| 3 ROOMS | $ 1,722 |
| 4 ROOMS | $ 2,041 |
Predict Short-Term Rental Revenue
Want to host your STR property on Airbnb?
Our Airbnb calculator is a free tool to calculate how much can you make on Airbnb.
Top Webster, MA Attractions and Activities
-
 Bowling Alley
 -
 Race Track
 -
 Park
Park -
 Hiking Trail
 -
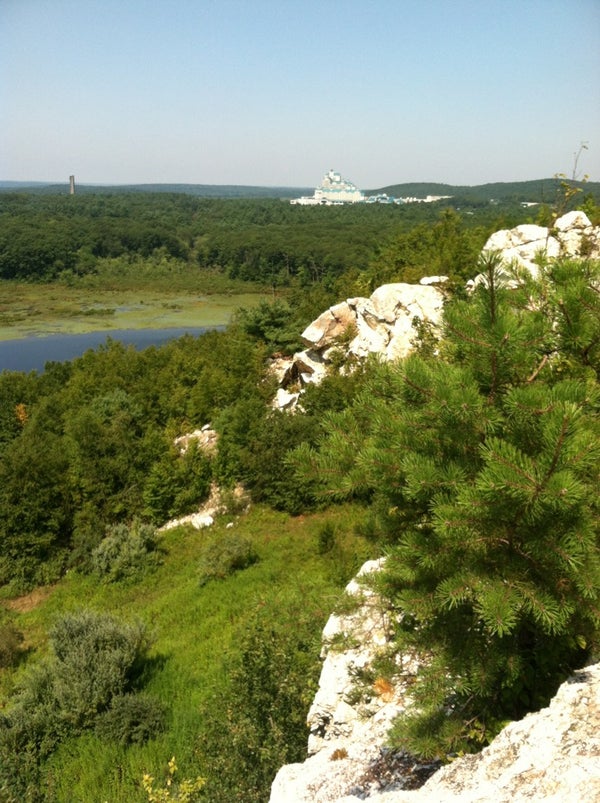
 Forest
 -

West Hill Dam
8.2
Park -
Hiking Trail
-
 Hiking Trail
 -
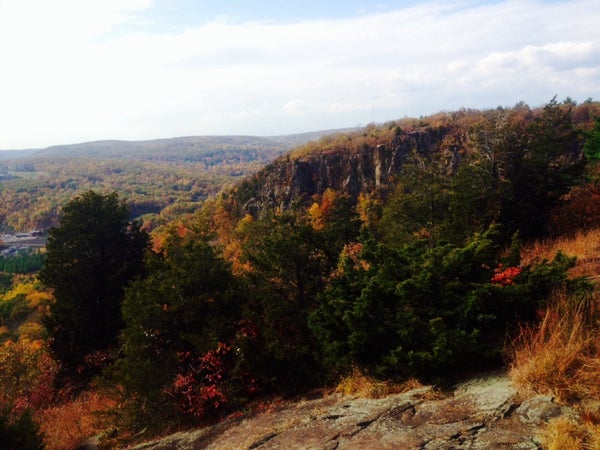 Hiking Trail
 -
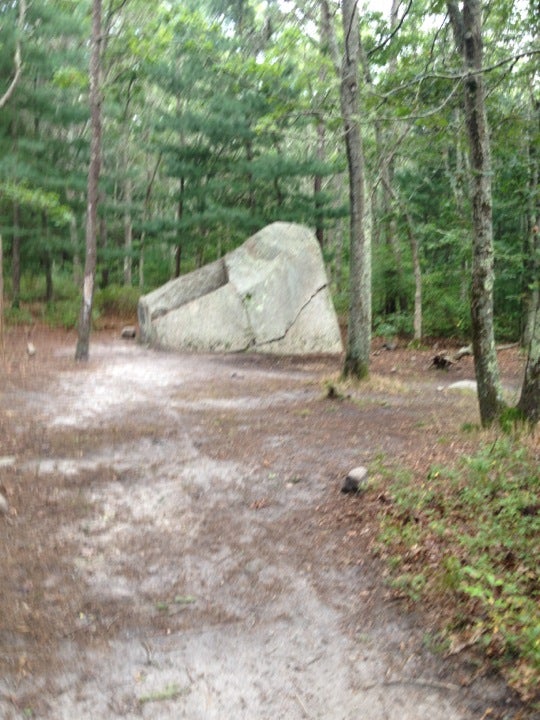
Beebe Woods
7.6
Hiking Trail
-

Indian Ranch
7.8
Campground -
 Farm
Farm -
Forest
-
Park
-
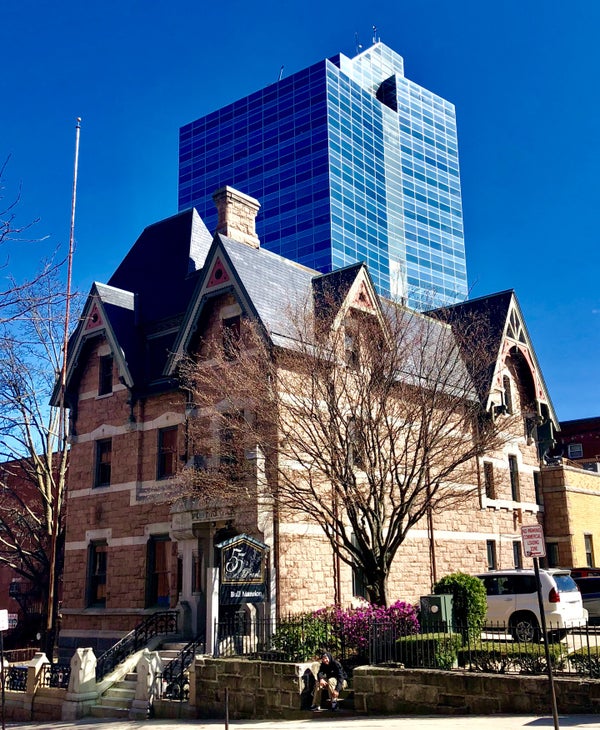
Bull Mansion
8.2
Historic and Protected Site


![%=topPerformingBlogs[i].title%>](https://images.mashvisor.com/40X40/C/https://www.mashvisor.com/blog/wp-content/uploads/2024/03/Vacation-Rental-Marketing-585x390.jpeg)
![%=topPerformingBlogs[i].title%>](https://images.mashvisor.com/40X40/C/https://www.mashvisor.com/blog/wp-content/uploads/2024/03/Airbnb-Amenities-585x390.jpeg)
![%=topPerformingBlogs[i].title%>](https://images.mashvisor.com/40X40/C/https://www.mashvisor.com/blog/wp-content/uploads/2024/03/Choosing-Vacation-Rental-Software-585x390.jpeg)


