Central City Investment Analysis
Investment Property in Central City, CO

Central City, CO Real Estate Investment Performance
$ 469,000
Median
1,328
Avg/Sq.ft.
2.00%
Traditional
7.00%
Airbnb
$ 2,381
Traditional
$ 5,891
Airbnb
$ 2,381
Traditional
$ 5,891
Airbnb
1
Investment
67
Airbnb
N/A
Traditional
58%
Airbnb occupancy rate
Central City, CO Properties Rental Prices
| RENTAL STRATEGY | 1 ROOM | 2 ROOMS | 3 ROOMS | 4 ROOMS |
|---|---|---|---|---|
| Airbnb | $ 2,921 | $ 4,286 | $ 5,014 | $ 5,891 |
| Traditional | $ 1,412 | $ 1,701 | $ 2,247 | $ 2,515 |
| 1 ROOM | $ 2,921 |
|---|---|
| 2 ROOMS | $ 4,286 |
| 3 ROOMS | $ 5,014 |
| 4 ROOMS | $ 5,891 |
| 1 ROOM | $ 1,412 |
|---|---|
| 2 ROOMS | $ 1,701 |
| 3 ROOMS | $ 2,247 |
| 4 ROOMS | $ 2,515 |
Predict Short-Term Rental Revenue
Want to host your STR property on Airbnb?
Our Airbnb calculator is a free tool to calculate how much can you make on Airbnb.
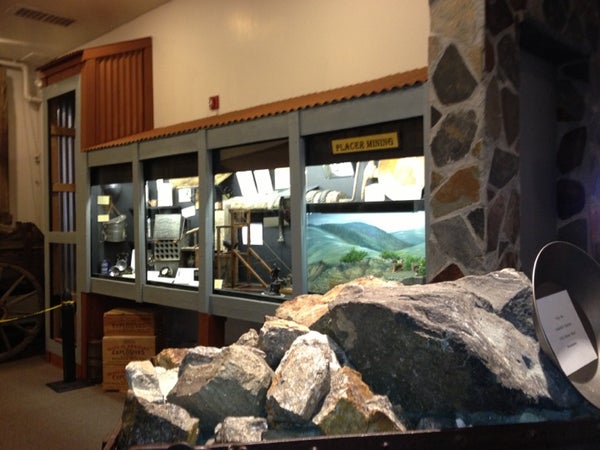
Top Central City, CO Attractions and Activities
-
 Brewery
 -
Dostal Alley
7.5
Casino -

Ameristar Casino
7.7
Casino -
 Rafting Spot
 -
 State or Provincial Park
 -
 Amusement Park
 -
 Tourist Information and Service
 -
Amusement Park
-
Rafting Spot
-
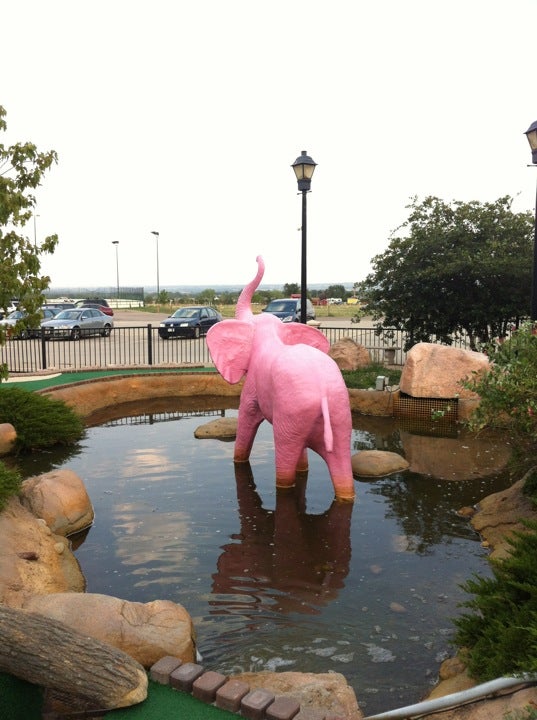 Amusement Park
 -

Coca-Cola Tubing
8.1
Attraction -
 Amusement Park
 -
 Hiking Trail
 -
 Hiking Trail
 -
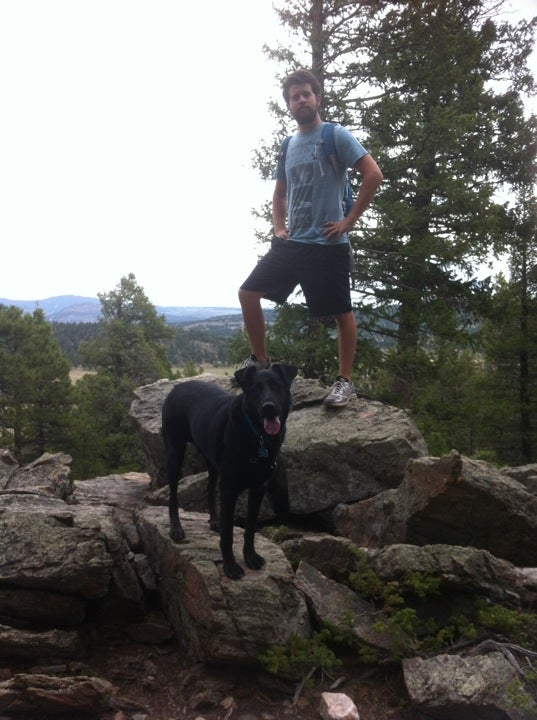
Elk Meadow Park
9.1
Park -
 Scenic Lookout

-
 Campground
 -

Mt. Evans
8.6
Hiking Trail -
State or Provincial Park
-
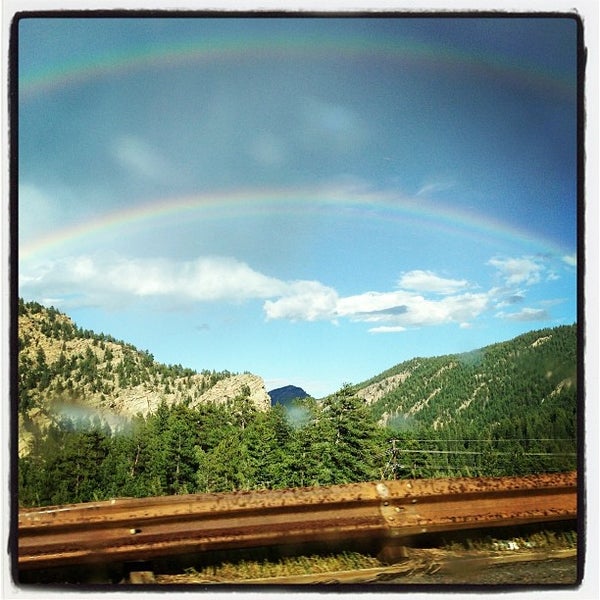
Rocky Mountains
8.9
Mountain -
 Scenic Lookout
 -
 Campground
 -

The Stage Stop
7.1
Historic and Protected Site -
 Historic and Protected Site
 -
 Historic and Protected Site
 -
 Historic and Protected Site
 -
The Stage Stop
7.1
Historic and Protected Site -
Historic and Protected Site
-
Historic and Protected Site
-
 Historic and Protected Site


![%=topPerformingBlogs[i].title%>](https://images.mashvisor.com/40X40/C/https://www.mashvisor.com/blog/wp-content/uploads/2024/03/Vacation-Rental-Marketing-585x390.jpeg)
![%=topPerformingBlogs[i].title%>](https://images.mashvisor.com/40X40/C/https://www.mashvisor.com/blog/wp-content/uploads/2024/03/Airbnb-Amenities-585x390.jpeg)
![%=topPerformingBlogs[i].title%>](https://images.mashvisor.com/40X40/C/https://www.mashvisor.com/blog/wp-content/uploads/2024/03/Choosing-Vacation-Rental-Software-585x390.jpeg)


