Distrct Heights Investment Analysis
Investment Property in Distrct Heights, MD

Distrct Heights, MD Real Estate Investment Performance
N/A
Median
N/A
Avg/Sq.ft.
2.00%
Traditional
6.00%
Airbnb
$ 1,843
Traditional
$ 3,787
Airbnb
$ 1,843
Traditional
$ 3,787
Airbnb
N/A
Investment
115
Airbnb
N/A
Traditional
59%
Airbnb occupancy rate
Distrct Heights, MD Properties Rental Prices
| RENTAL STRATEGY | 1 ROOM | 2 ROOMS | 3 ROOMS | 4 ROOMS |
|---|---|---|---|---|
| Airbnb | $ 1,427 | $ 1,814 | $ 3,787 | $ 3,782 |
| Traditional | $ 1,587 | $ 1,804 | $ 2,250 | $ 2,663 |
| 1 ROOM | $ 1,427 |
|---|---|
| 2 ROOMS | $ 1,814 |
| 3 ROOMS | $ 3,787 |
| 4 ROOMS | $ 3,782 |
| 1 ROOM | $ 1,587 |
|---|---|
| 2 ROOMS | $ 1,804 |
| 3 ROOMS | $ 2,250 |
| 4 ROOMS | $ 2,663 |
Predict Short-Term Rental Revenue
Want to host your STR property on Airbnb?
Our Airbnb calculator is a free tool to calculate how much can you make on Airbnb.
Top Distrct Heights, MD Attractions and Activities
-
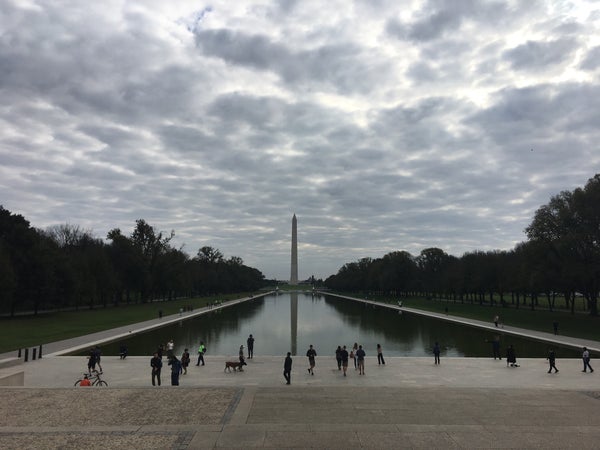
Lincoln Memorial
9.6
Monument -
 Monument
 -
 Hotel
Hotel -
 Monument
 -

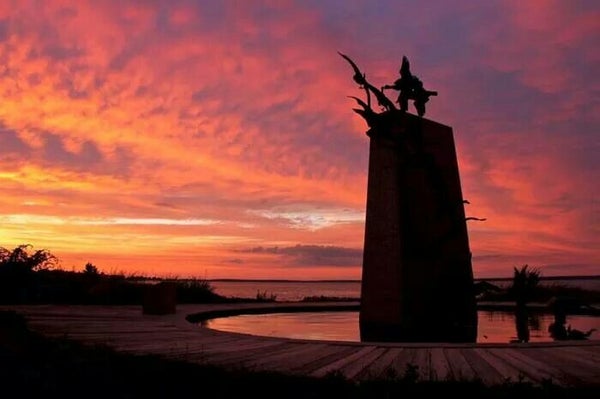
Walker Mill Park
7.7
Park -
 Park
Park
-
Walker Mill Park
7.7
Park -
 Monument
 -

Fort Davis
7.2
Historic and Protected Site -
Fort Davis
7.2
Historic and Protected Site -
 Historic and Protected Site
 -
Fort Davis
7.2
Historic and Protected Site -
Historic and Protected Site
-
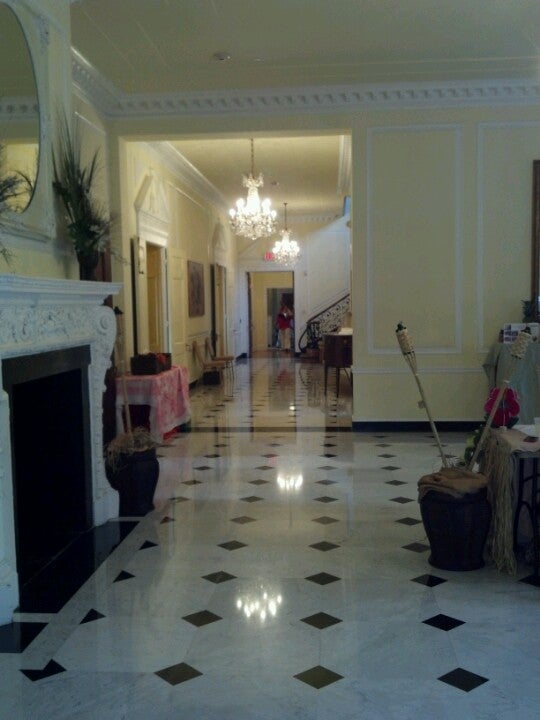
Oxon Hill Manor
8.3
Historic and Protected Site -
 Scenic Lookout
 -
 Historic and Protected Site
 -
 Park
Park -
 Historic and Protected Site
 -
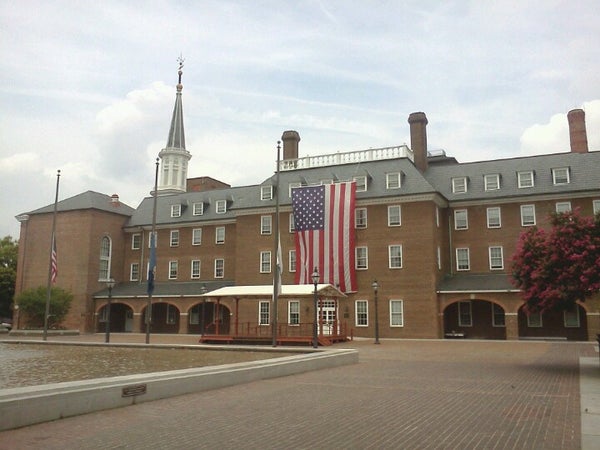
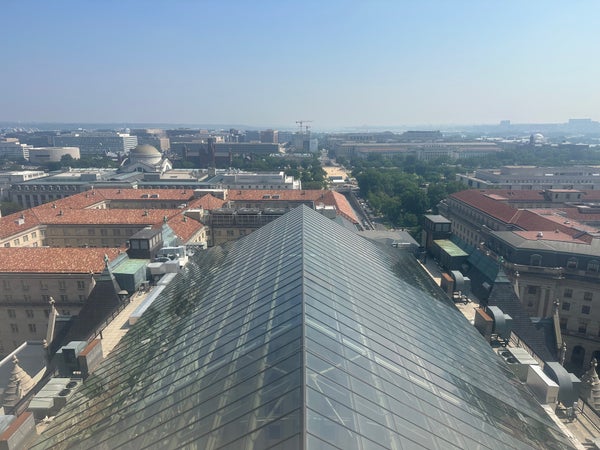
Market Square
7.8
Plaza -
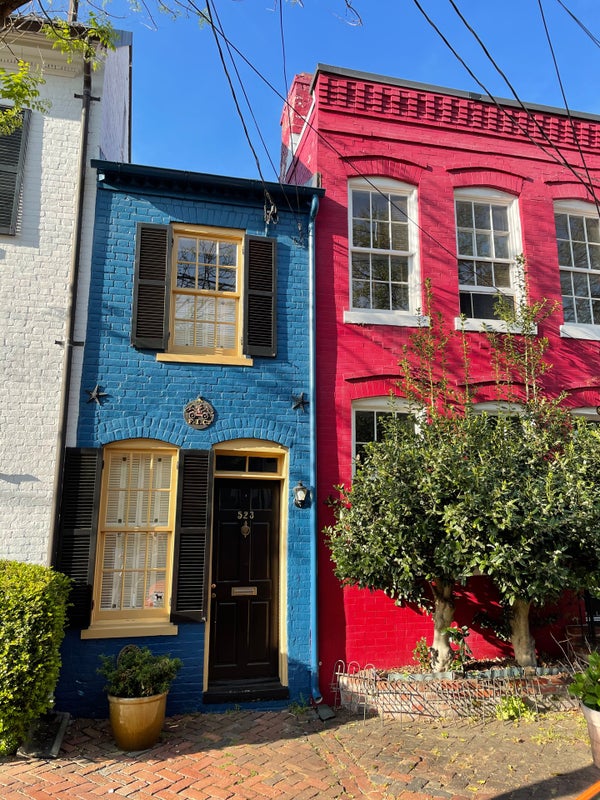
The Spite House
7.7
Historic and Protected Site -
 Historic and Protected Site
 -
 Historic and Protected Site
 -
 Historic and Protected Site
 -
 Historic and Protected Site
 -
 Historic and Protected Site
 -

Whittemore House
7.1
Historic and Protected Site -
Fort Stevens
7.3
Historic and Protected Site -
 Structure
 -
 History Museum


![%=topPerformingBlogs[i].title%>](https://images.mashvisor.com/40X40/C/https://www.mashvisor.com/blog/wp-content/uploads/2024/03/Vacation-Rental-Marketing-585x390.jpeg)
![%=topPerformingBlogs[i].title%>](https://images.mashvisor.com/40X40/C/https://www.mashvisor.com/blog/wp-content/uploads/2024/03/Airbnb-Amenities-585x390.jpeg)
![%=topPerformingBlogs[i].title%>](https://images.mashvisor.com/40X40/C/https://www.mashvisor.com/blog/wp-content/uploads/2024/03/Choosing-Vacation-Rental-Software-585x390.jpeg)


