Gibraltar Investment Analysis
Investment Property in Gibraltar, MI

Gibraltar, MI Real Estate Investment Performance
$ 269,900
Median
1,360
Avg/Sq.ft.
4.00%
Traditional
6.00%
Airbnb
$ 1,826
Traditional
$ 2,436
Airbnb
$ 1,826
Traditional
$ 2,436
Airbnb
4
Investment
12
Airbnb
1
Traditional
67%
Airbnb occupancy rate
Gibraltar, MI Properties Rental Prices
| RENTAL STRATEGY | 1 ROOM | 2 ROOMS | 3 ROOMS | 4 ROOMS |
|---|---|---|---|---|
| Airbnb | $ 1,838 | $ 2,436 | $ 4,171 | N/A |
| Traditional | $ 1,000 | $ 1,296 | $ 1,563 | $ 1,677 |
| 1 ROOM | $ 1,838 |
|---|---|
| 2 ROOMS | $ 2,436 |
| 3 ROOMS | $ 4,171 |
| 4 ROOMS | N/A |
| 1 ROOM | $ 1,000 |
|---|---|
| 2 ROOMS | $ 1,296 |
| 3 ROOMS | $ 1,563 |
| 4 ROOMS | $ 1,677 |
Predict Short-Term Rental Revenue
Want to host your STR property on Airbnb?
Our Airbnb calculator is a free tool to calculate how much can you make on Airbnb.
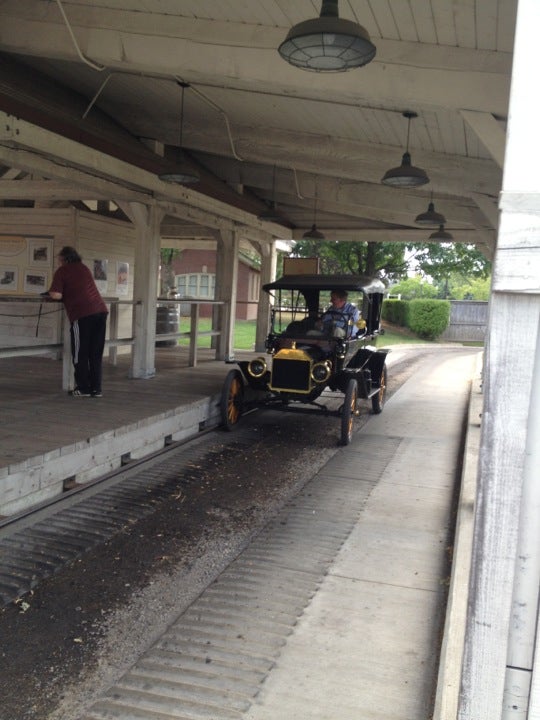
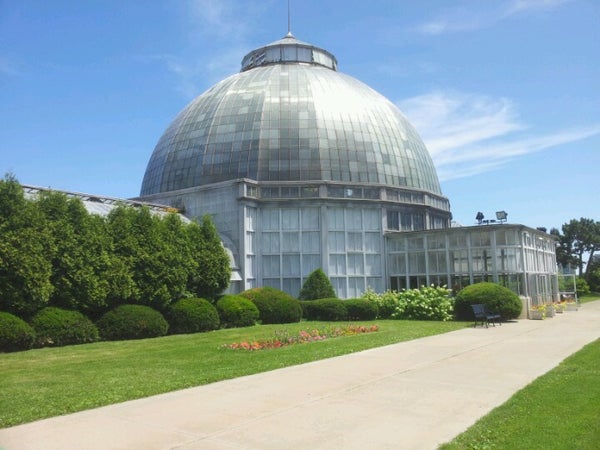
Top Gibraltar, MI Attractions and Activities
-
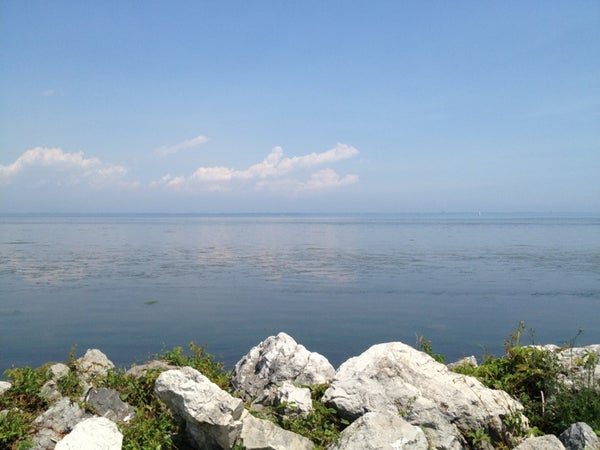 Park
Park -

Elizabeth Park
8.8
Park -
 Movie Theater
 -
 Theater
 -
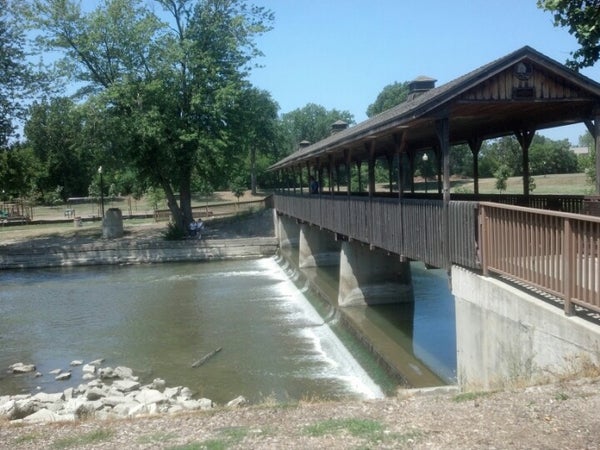
Huroc
7.2
Park -
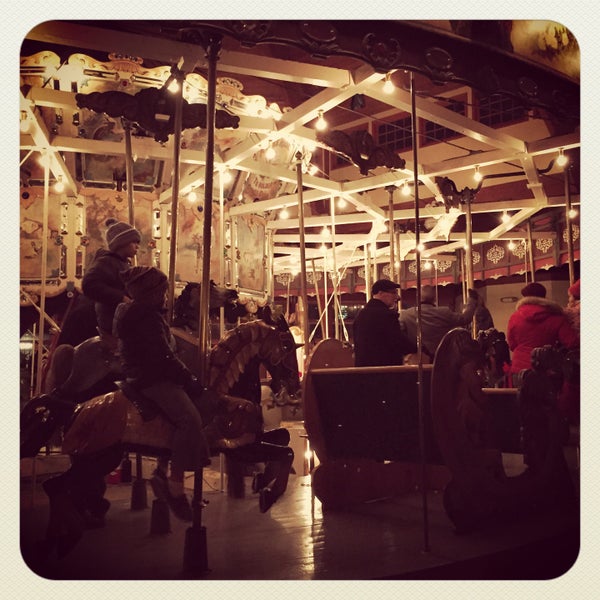 Amusement Park
 -
 Amusement Park
-
Park
-
Elizabeth Park
8.8
Park -
Huroc
7.2
Park -
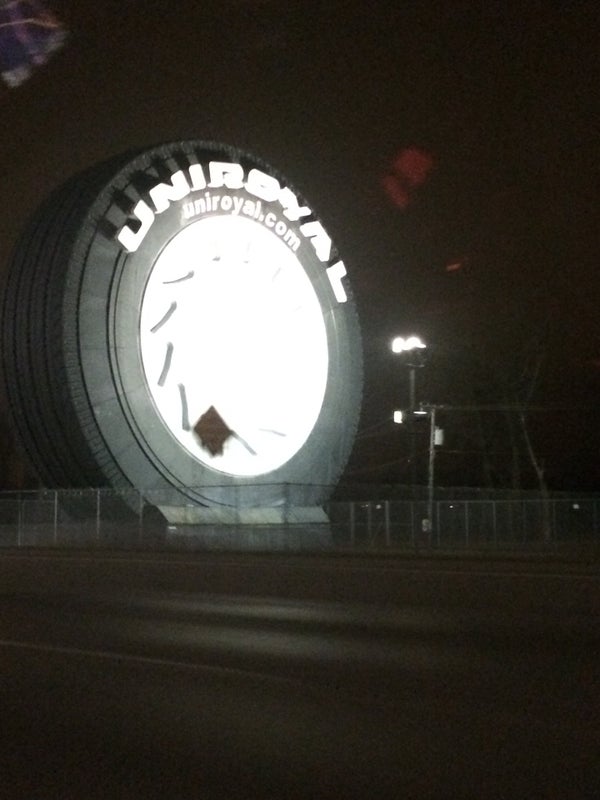
Uniroyal Tire
8.1
Historic and Protected Site -
Uniroyal Tire
8.1
Monument -
 Historic and Protected Site
 -

Firestone Farm
7.9
Farm -
 National Park
 -
 Historic and Protected Site
 -
 Historic and Protected Site
 -
Historic and Protected Site
-
 Historic and Protected Site
 -
 Historic and Protected Site
 -
 Historic and Protected Site
 -

Campus Martius
9.3
Park -
 Historic and Protected Site
 -
 Historic and Protected Site
 -
 Historic and Protected Site
 -
 Garden
 -
 Historic and Protected Site


![%=topPerformingBlogs[i].title%>](https://images.mashvisor.com/40X40/C/https://www.mashvisor.com/blog/wp-content/uploads/2021/12/how-to-calculate-vacancy-rate-585x390.jpg)
![%=topPerformingBlogs[i].title%>](https://images.mashvisor.com/40X40/C/https://www.mashvisor.com/blog/wp-content/uploads/2024/03/Vacation-Rental-Marketing-585x390.jpeg)
![%=topPerformingBlogs[i].title%>](https://images.mashvisor.com/40X40/C/https://www.mashvisor.com/blog/wp-content/uploads/2024/03/Airbnb-Amenities-585x390.jpeg)
![%=topPerformingBlogs[i].title%>](https://images.mashvisor.com/40X40/C/https://www.mashvisor.com/blog/wp-content/uploads/2024/03/Choosing-Vacation-Rental-Software-585x390.jpeg)


