Brookline Investment Analysis
Investment Property in Brookline, MO

Brookline, MO Real Estate Investment Performance
$ 354,995
Median
1,951
Avg/Sq.ft.
4.00%
Traditional
4.00%
Airbnb
$ 2,149
Traditional
$ 2,762
Airbnb
$ 2,149
Traditional
$ 2,762
Airbnb
1
Investment
33
Airbnb
N/A
Traditional
67%
Airbnb occupancy rate
Brookline, MO Properties Rental Prices
| RENTAL STRATEGY | 1 ROOM | 2 ROOMS | 3 ROOMS | 4 ROOMS |
|---|---|---|---|---|
| Airbnb | $ 1,766 | $ 1,402 | $ 2,762 | N/A |
| Traditional | $ 725 | $ 923 | $ 1,275 | $ 1,440 |
| 1 ROOM | $ 1,766 |
|---|---|
| 2 ROOMS | $ 1,402 |
| 3 ROOMS | $ 2,762 |
| 4 ROOMS | N/A |
| 1 ROOM | $ 725 |
|---|---|
| 2 ROOMS | $ 923 |
| 3 ROOMS | $ 1,275 |
| 4 ROOMS | $ 1,440 |
Predict Short-Term Rental Revenue
Want to host your STR property on Airbnb?
Our Airbnb calculator is a free tool to calculate how much can you make on Airbnb.
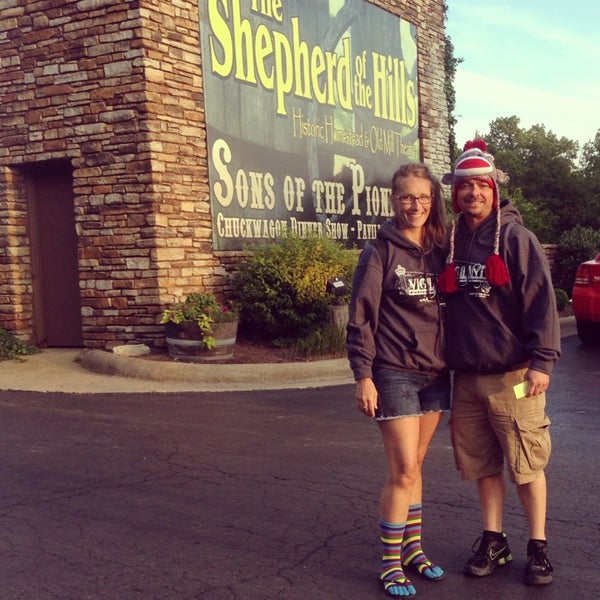
Top Brookline, MO Attractions and Activities
-
 Fuel Station
 -
 Park
Park -
 Historic and Protected Site
 -
 Park
Park -
 Sports Bar
 -
 Gym and Studio
 -

Cruse Dog Park
7.3
Dog Park -

Sequiota Park
8.5
Park
-
Park
-
Historic and Protected Site
-
 Campground
 -
Park
-
Hiking Trail
-
 Garden
 -
 Hiking Trail
 -
Cruse Dog Park
7.3
Dog Park -
 Hiking Trail
 -
Historic and Protected Site
-
 Historic and Protected Site
 -
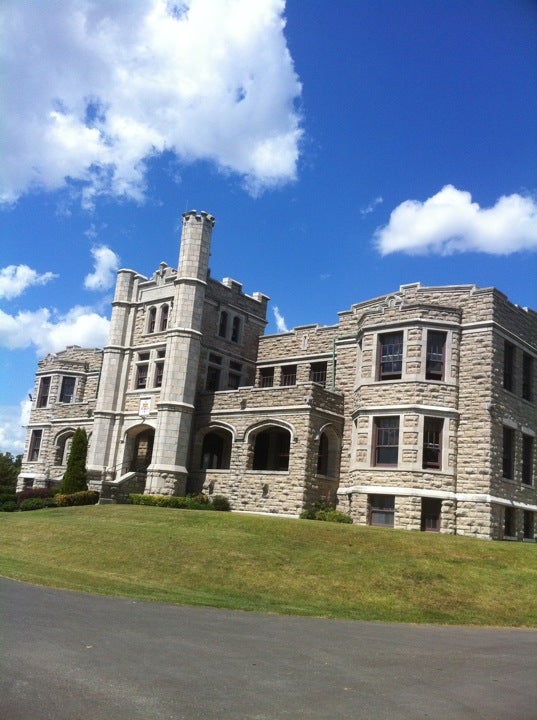
Pythian Castle
7.3
Historic and Protected Site -
Historic and Protected Site
-
Historic and Protected Site
-
Pythian Castle
7.3
Historic and Protected Site -
 Performing Arts Venue
 -
 Historic and Protected Site
 -
 Plaza
Plaza


![%=topPerformingBlogs[i].title%>](https://images.mashvisor.com/40X40/C/https://www.mashvisor.com/blog/wp-content/uploads/2024/03/Vacation-Rental-Marketing-585x390.jpeg)
![%=topPerformingBlogs[i].title%>](https://images.mashvisor.com/40X40/C/https://www.mashvisor.com/blog/wp-content/uploads/2024/03/Airbnb-Amenities-585x390.jpeg)
![%=topPerformingBlogs[i].title%>](https://images.mashvisor.com/40X40/C/https://www.mashvisor.com/blog/wp-content/uploads/2024/03/Choosing-Vacation-Rental-Software-585x390.jpeg)


