Village Of Oaks Investment Analysis
Investment Property in Village Of Oaks, MO

Village Of Oaks, MO Real Estate Investment Performance
$ 425,000
Median
3,700
Avg/Sq.ft.
5.00%
Traditional
6.00%
Airbnb
$ 2,968
Traditional
$ 4,316
Airbnb
$ 2,968
Traditional
$ 4,316
Airbnb
1
Investment
77
Airbnb
N/A
Traditional
63%
Airbnb occupancy rate
Village Of Oaks, MO Properties Rental Prices
| RENTAL STRATEGY | 1 ROOM | 2 ROOMS | 3 ROOMS | 4 ROOMS |
|---|---|---|---|---|
| Airbnb | $ 1,264 | $ 1,753 | $ 2,688 | $ 4,316 |
| Traditional | $ 1,125 | $ 1,292 | $ 1,688 | $ 1,979 |
| 1 ROOM | $ 1,264 |
|---|---|
| 2 ROOMS | $ 1,753 |
| 3 ROOMS | $ 2,688 |
| 4 ROOMS | $ 4,316 |
| 1 ROOM | $ 1,125 |
|---|---|
| 2 ROOMS | $ 1,292 |
| 3 ROOMS | $ 1,688 |
| 4 ROOMS | $ 1,979 |
Predict Short-Term Rental Revenue
Want to host your STR property on Airbnb?
Our Airbnb calculator is a free tool to calculate how much can you make on Airbnb.
Top Village Of Oaks, MO Attractions and Activities
-
Linden Square
8.1
Park -

Shooter's
7.8
Dive Bar -
Happy Rock Park
8.7
Park -
Side Pockets
7.1
Sports Bar -
Penguin Park
7.5
Park -

Gladstone Bowl
7.4
Bowling Alley -
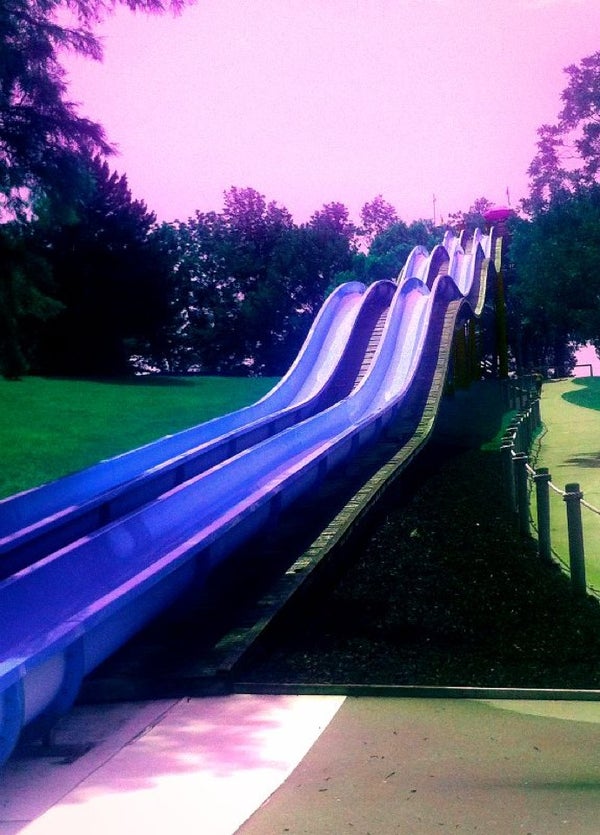
 Water Park
 -
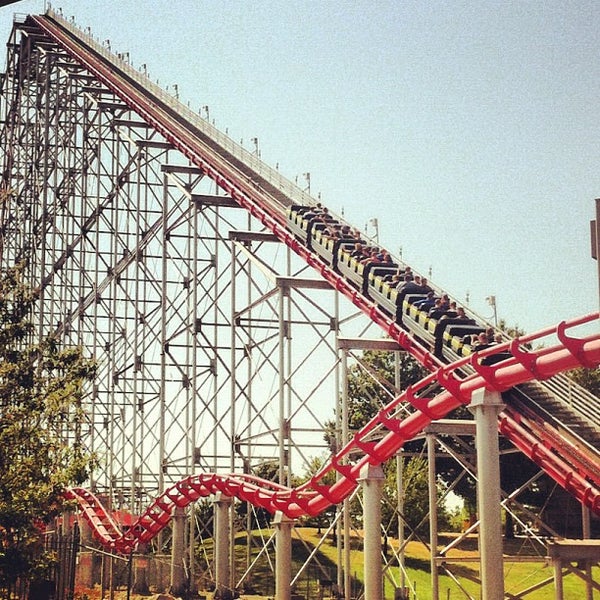
Worlds of Fun
8.2
Amusement Park -

Planet Snoopy
7.9
Amusement Park -
 Amusement Park
 -
Patriot
7.7
Amusement Park -
Oceans Of Fun
7.8
Amusement Park -
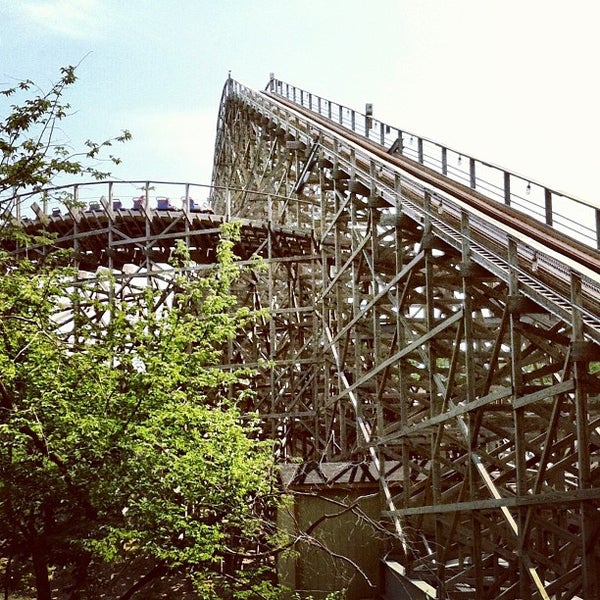
The Mamba
7.6
Amusement Park -
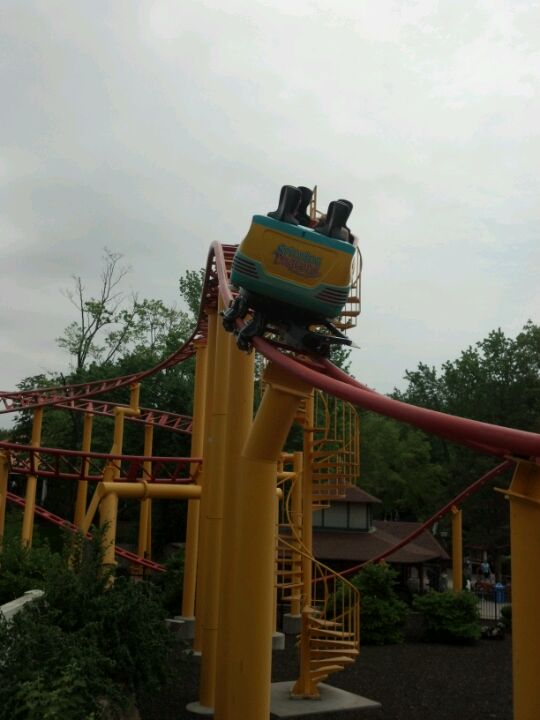
Prowler
7.6
Amusement Park -
Spinning Dragons
7.2
Amusement Park -

Fury of the Nile
7.2
Amusement Park
-
Linden Square
8.1
Park -
Happy Rock Park
8.7
Park -
 Dog Park
 -
Macken Park
8.6
Park -
Penguin Park
7.5
Park -
 Hiking Trail
 -
 Historic and Protected Site
 -
 Historic and Protected Site
 -
Historic and Protected Site
-
 Historic and Protected Site
 -
Pierpont's
8.8
Steakhouse


![%=topPerformingBlogs[i].title%>](https://images.mashvisor.com/40X40/C/https://www.mashvisor.com/blog/wp-content/uploads/2021/12/how-to-calculate-vacancy-rate-585x390.jpg)
![%=topPerformingBlogs[i].title%>](https://images.mashvisor.com/40X40/C/https://www.mashvisor.com/blog/wp-content/uploads/2024/03/Vacation-Rental-Marketing-585x390.jpeg)
![%=topPerformingBlogs[i].title%>](https://images.mashvisor.com/40X40/C/https://www.mashvisor.com/blog/wp-content/uploads/2024/03/Airbnb-Amenities-585x390.jpeg)
![%=topPerformingBlogs[i].title%>](https://images.mashvisor.com/40X40/C/https://www.mashvisor.com/blog/wp-content/uploads/2024/03/Choosing-Vacation-Rental-Software-585x390.jpeg)


