Somers Point City Investment Analysis
Investment Property in Somers Point City, NJ

Somers Point City, NJ Real Estate Investment Performance
N/A
Median
N/A
Avg/Sq.ft.
N/A
Traditional
N/A
Airbnb
N/A
Traditional
N/A
Airbnb
N/A
Traditional
N/A
Airbnb
N/A
Investment
448
Airbnb
N/A
Traditional
41%
Airbnb occupancy rate
Somers Point City, NJ Properties Rental Prices
| RENTAL STRATEGY | 1 ROOM | 2 ROOMS | 3 ROOMS | 4 ROOMS |
|---|---|---|---|---|
| Airbnb | $ 2,994 | $ 2,962 | $ 3,734 | $ 5,416 |
| Traditional | $ 1,375 | $ 1,635 | $ 2,094 | $ 2,552 |
| 1 ROOM | $ 2,994 |
|---|---|
| 2 ROOMS | $ 2,962 |
| 3 ROOMS | $ 3,734 |
| 4 ROOMS | $ 5,416 |
| 1 ROOM | $ 1,375 |
|---|---|
| 2 ROOMS | $ 1,635 |
| 3 ROOMS | $ 2,094 |
| 4 ROOMS | $ 2,552 |
Predict Short-Term Rental Revenue
Want to host your STR property on Airbnb?
Our Airbnb calculator is a free tool to calculate how much can you make on Airbnb.
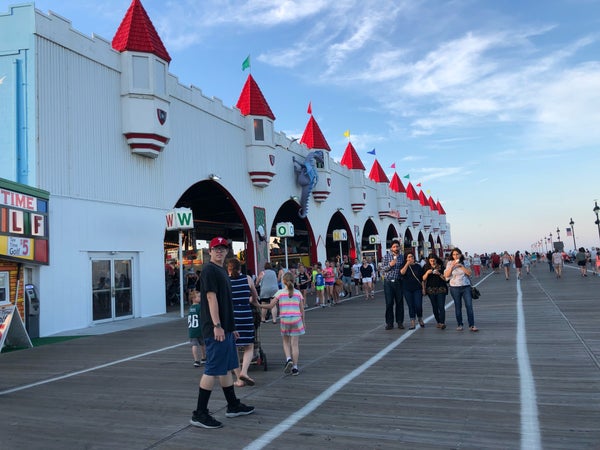
Top Somers Point City, NJ Attractions and Activities
-
 Waterfront
 -
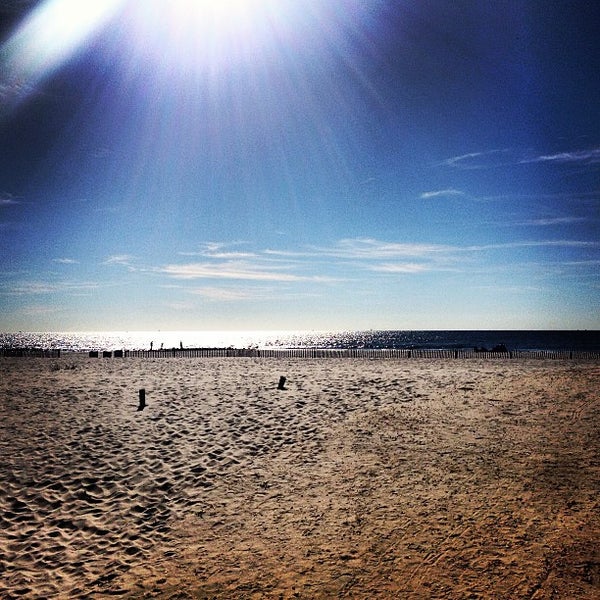 Beach
Beach -

Ocean City Beach
8.5
Beach -

4th Street Beach
8.6
Beach -

8th Street Beach
8.4
Beach -
 Beach
Beach -
 Beach
Beach -

Seaspray Beach
8.1
Surf Spot -
 Beach
Beach -

2nd Street Beach
7.9
Beach -
 Beach
Beach -
 Beach
Beach -

6th Street Beach
7.7
Beach -

5th Street Beach
7.6
Beach -
 Harbor or Marina
 -
 Park
Park -
 Beach
Beach -
 Beach
Beach -

9th Street Beach
7.2
Beach -
 Park
Park -
 Golf Course
 -

JiLLy's Arcade
8.6
Arcade -
 Concert Hall
 -
 Dog Park
 -
 Water Park
 -
 Arcade
 -
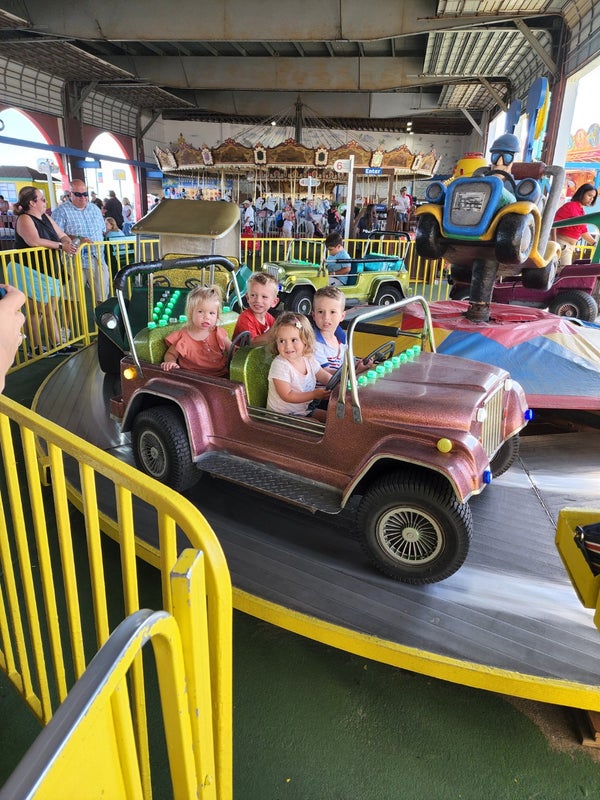 Amusement Park
 -

Ferris Wheel
7.5
Attraction -
 Amusement Park
 -

Haunted Golf
7.1
Mini Golf Course -
 Amusement Park
 -
Amusement Park
-
Amusement Park
-
Amusement Park
-
Amusement Park
-

Storybook Land
7.9
Amusement Park -
Ferris Wheel
7.5
Attraction
-
Waterfront
-
Beach
-
Ocean City Beach
8.5
Beach -
4th Street Beach
8.6
Beach -
8th Street Beach
8.4
Beach -
Beach
-
Beach
-
Seaspray Beach
8.1
Surf Spot -
Beach
-
2nd Street Beach
7.9
Beach -
Beach
-
Beach
-
6th Street Beach
7.7
Beach -
5th Street Beach
7.6
Beach -
Harbor or Marina
-
Park
-
Beach
-
Beach
-
9th Street Beach
7.2
Beach -
 Historic and Protected Site
 -
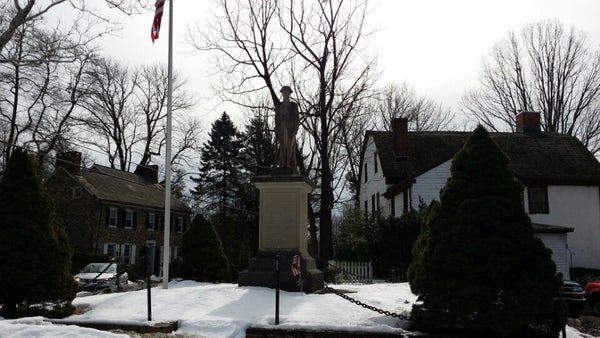
Monument
-
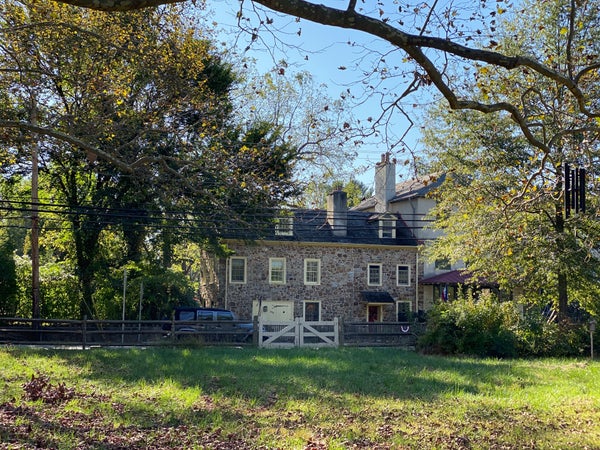
 Bed and Breakfast
 -
 Historic and Protected Site
 -
 Other Great Outdoors
 -
 Neighborhood
 -
 Historic and Protected Site
 -
 National Park
 -
 History Museum
 -
 Historic and Protected Site
 -
 History Museum
 -
 Park
Park -
 Historic and Protected Site
 -
 History Museum
 -
 Historic and Protected Site
 -
 Historic and Protected Site


![%=topPerformingBlogs[i].title%>](https://images.mashvisor.com/40X40/C/https://www.mashvisor.com/blog/wp-content/uploads/2021/12/how-to-calculate-vacancy-rate-585x390.jpg)
![%=topPerformingBlogs[i].title%>](https://images.mashvisor.com/40X40/C/https://www.mashvisor.com/blog/wp-content/uploads/2024/03/Vacation-Rental-Marketing-585x390.jpeg)
![%=topPerformingBlogs[i].title%>](https://images.mashvisor.com/40X40/C/https://www.mashvisor.com/blog/wp-content/uploads/2024/03/Airbnb-Amenities-585x390.jpeg)
![%=topPerformingBlogs[i].title%>](https://images.mashvisor.com/40X40/C/https://www.mashvisor.com/blog/wp-content/uploads/2024/03/Choosing-Vacation-Rental-Software-585x390.jpeg)


