Trenton City Investment Analysis
Investment Property in Trenton City, NJ

Trenton City, NJ Real Estate Investment Performance
$ 249,999
Median
1,308
Avg/Sq.ft.
9.00%
Traditional
9.00%
Airbnb
$ 2,488
Traditional
$ 3,816
Airbnb
$ 2,488
Traditional
$ 3,816
Airbnb
3
Investment
48
Airbnb
2
Traditional
55%
Airbnb occupancy rate
Trenton City, NJ Properties Rental Prices
| RENTAL STRATEGY | 1 ROOM | 2 ROOMS | 3 ROOMS | 4 ROOMS |
|---|---|---|---|---|
| Airbnb | $ 1,488 | $ 2,408 | $ 2,167 | N/A |
| Traditional | $ 844 | $ 1,872 | $ 2,064 | $ 1,490 |
| 1 ROOM | $ 1,488 |
|---|---|
| 2 ROOMS | $ 2,408 |
| 3 ROOMS | $ 2,167 |
| 4 ROOMS | N/A |
| 1 ROOM | $ 844 |
|---|---|
| 2 ROOMS | $ 1,872 |
| 3 ROOMS | $ 2,064 |
| 4 ROOMS | $ 1,490 |
Predict Short-Term Rental Revenue
Want to host your STR property on Airbnb?
Our Airbnb calculator is a free tool to calculate how much can you make on Airbnb.
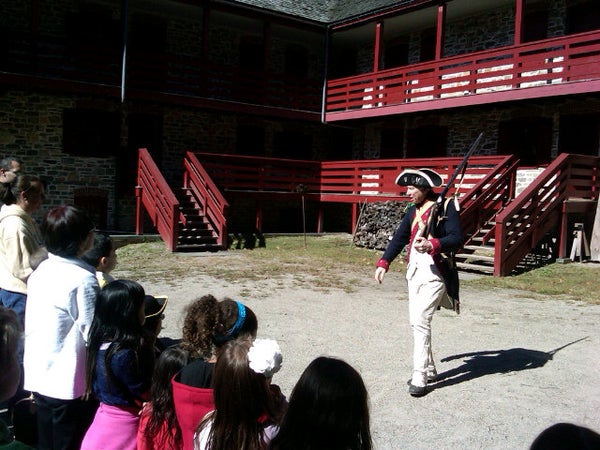
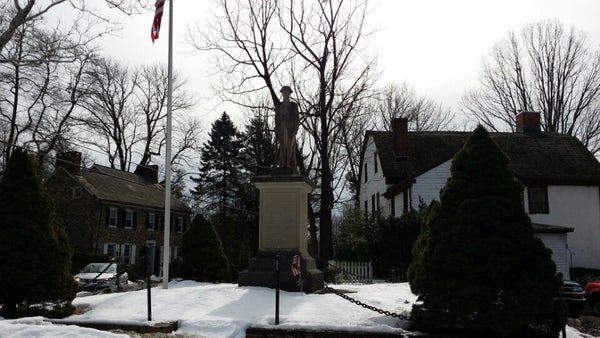
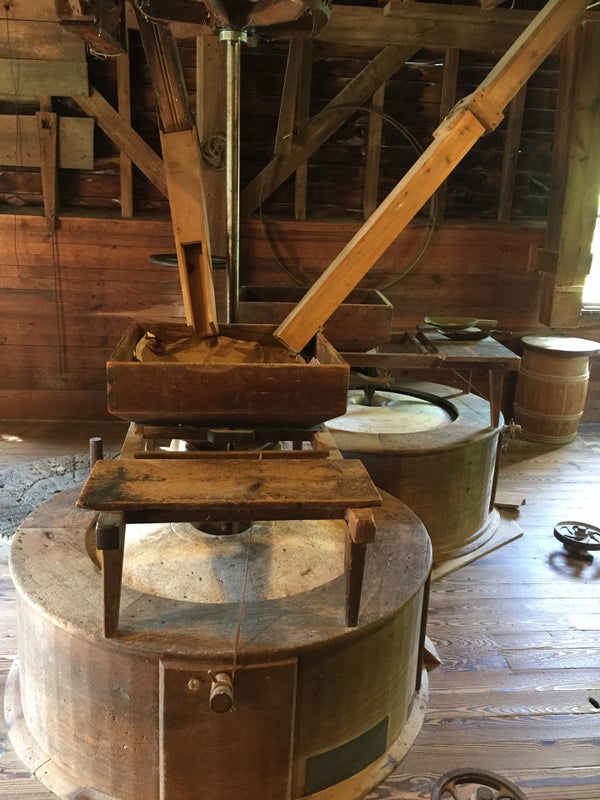
Top Trenton City, NJ Attractions and Activities
-
 Flea Market
 -

Artworks
8.2
Art Gallery -
 Tattoo Parlor
 -
 Performing Arts Venue
 -
 Art Gallery
 -
 Baseball Stadium
 -
 Museum
 -
 Art Museum
 -

Kuser Farm Park
7.6
Park -
 History Museum
 -
 Art Gallery
 -
 Museum
 -
 Amusement Park
 -

Sesame Place
8.2
Amusement Park -
 Amusement Park
 -
 Amusement Park
-
Kuser Farm Park
7.6
Park -

Nine Muses
8.3
Sculpture Garden -

The Meadow
8.1
Sculpture Garden -
 Rock Climbing Spot
 -
 Tunnel
 -
 History Museum
 -
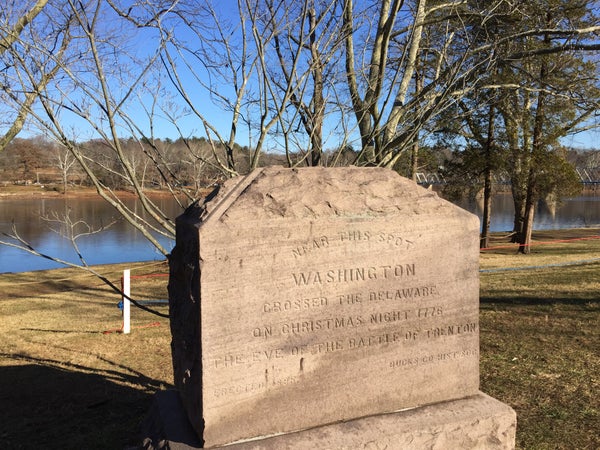 Historic and Protected Site
 -
 Park
Park -
 Other Great Outdoors
 -
 Historic and Protected Site
 -
 Historic and Protected Site
 -
 National Park
 -
 History Museum
 -
 Historic and Protected Site
 -
 Historic and Protected Site
 -
 American Restaurant
 -
 National Park
 -
 Event Space
 -
 History Museum
 -
 Lighthouse
 -
 Historic and Protected Site
 -
 Hotel
Hotel -
 Historic and Protected Site
 -
 National Park
 -
Historic and Protected Site
-
 History Museum


![%=topPerformingBlogs[i].title%>](https://images.mashvisor.com/40X40/C/https://www.mashvisor.com/blog/wp-content/uploads/2024/03/Vacation-Rental-Marketing-585x390.jpeg)
![%=topPerformingBlogs[i].title%>](https://images.mashvisor.com/40X40/C/https://www.mashvisor.com/blog/wp-content/uploads/2024/03/Airbnb-Amenities-585x390.jpeg)
![%=topPerformingBlogs[i].title%>](https://images.mashvisor.com/40X40/C/https://www.mashvisor.com/blog/wp-content/uploads/2024/03/Choosing-Vacation-Rental-Software-585x390.jpeg)


