Kingsville Investment Analysis
Investment Property in Kingsville, OH

Kingsville, OH Real Estate Investment Performance
$ 249,900
Median
2,396
Avg/Sq.ft.
5.00%
Traditional
9.00%
Airbnb
$ 1,783
Traditional
$ 3,321
Airbnb
$ 1,783
Traditional
$ 3,321
Airbnb
3
Investment
25
Airbnb
N/A
Traditional
43%
Airbnb occupancy rate
Kingsville, OH Properties Rental Prices
| RENTAL STRATEGY | 1 ROOM | 2 ROOMS | 3 ROOMS | 4 ROOMS |
|---|---|---|---|---|
| Airbnb | $ 1,212 | $ 1,396 | $ 3,321 | $ 3,051 |
| Traditional | N/A | N/A | N/A | N/A |
| 1 ROOM | $ 1,212 |
|---|---|
| 2 ROOMS | $ 1,396 |
| 3 ROOMS | $ 3,321 |
| 4 ROOMS | $ 3,051 |
| 1 ROOM | N/A |
|---|---|
| 2 ROOMS | N/A |
| 3 ROOMS | N/A |
| 4 ROOMS | N/A |
Predict Short-Term Rental Revenue
Want to host your STR property on Airbnb?
Our Airbnb calculator is a free tool to calculate how much can you make on Airbnb.
Top Kingsville, OH Attractions and Activities
-

Lakeshore Park
8.3
Beach -
Movie Theater
-
 Bridge
 -

Adventure Zone
7.2
Amusement Park -
 Amusement Park
-
 Farm
Farm -
Lakeshore Park
8.3
Beach -
 Beach
Beach -
 Park
Park -
 Beach
Beach -
 Historic and Protected Site
 -
 Tourist Information and Service
 -
 Library
 -
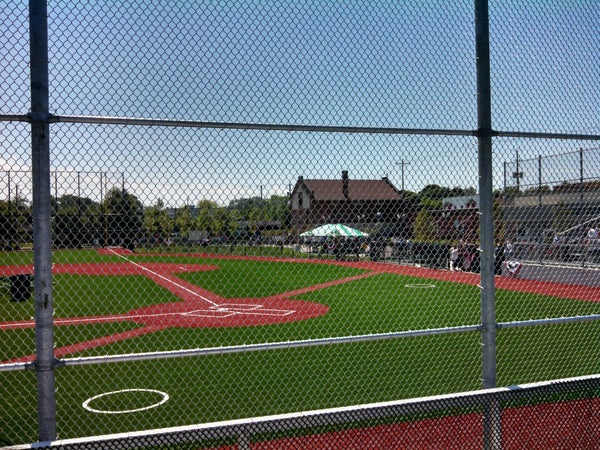 Baseball Field
 -
 Historic and Protected Site
 -
 Restaurant
 -
 Pizzeria


![%=topPerformingBlogs[i].title%>](https://images.mashvisor.com/40X40/C/https://www.mashvisor.com/blog/wp-content/uploads/2024/03/Vacation-Rental-Marketing-585x390.jpeg)
![%=topPerformingBlogs[i].title%>](https://images.mashvisor.com/40X40/C/https://www.mashvisor.com/blog/wp-content/uploads/2024/03/Airbnb-Amenities-585x390.jpeg)
![%=topPerformingBlogs[i].title%>](https://images.mashvisor.com/40X40/C/https://www.mashvisor.com/blog/wp-content/uploads/2024/03/Choosing-Vacation-Rental-Software-585x390.jpeg)


