Manzanita Investment Analysis
Investment Property in Manzanita, OR

Manzanita, OR Real Estate Investment Performance
$ 1,080,000
Median
2,365
Avg/Sq.ft.
1.00%
Traditional
5.00%
Airbnb
$ 2,268
Traditional
$ 5,543
Airbnb
$ 2,268
Traditional
$ 5,543
Airbnb
1
Investment
195
Airbnb
N/A
Traditional
66%
Airbnb occupancy rate
Manzanita, OR Properties Rental Prices
| RENTAL STRATEGY | 1 ROOM | 2 ROOMS | 3 ROOMS | 4 ROOMS |
|---|---|---|---|---|
| Airbnb | $ 3,314 | $ 3,732 | $ 4,946 | $ 6,139 |
| Traditional | N/A | N/A | N/A | N/A |
| 1 ROOM | $ 3,314 |
|---|---|
| 2 ROOMS | $ 3,732 |
| 3 ROOMS | $ 4,946 |
| 4 ROOMS | $ 6,139 |
| 1 ROOM | N/A |
|---|---|
| 2 ROOMS | N/A |
| 3 ROOMS | N/A |
| 4 ROOMS | N/A |
Predict Short-Term Rental Revenue
Want to host your STR property on Airbnb?
Our Airbnb calculator is a free tool to calculate how much can you make on Airbnb.
Top Manzanita, OR Attractions and Activities
-
 State or Provincial Park
 -
 State or Provincial Park
 -

Barview Jetty
7.6
Park -

Ecola State Park
9.3
State or Provincial Park -
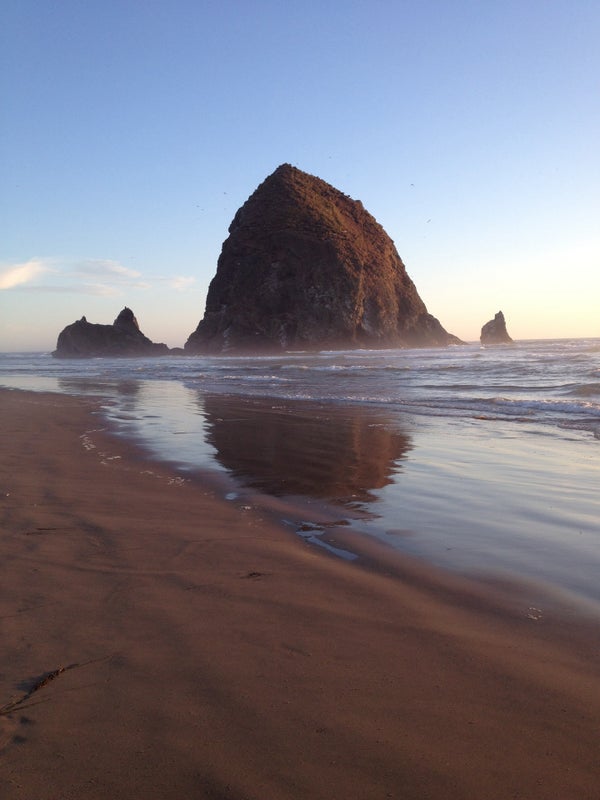
Haystack Rock
9.5
Mountain
-
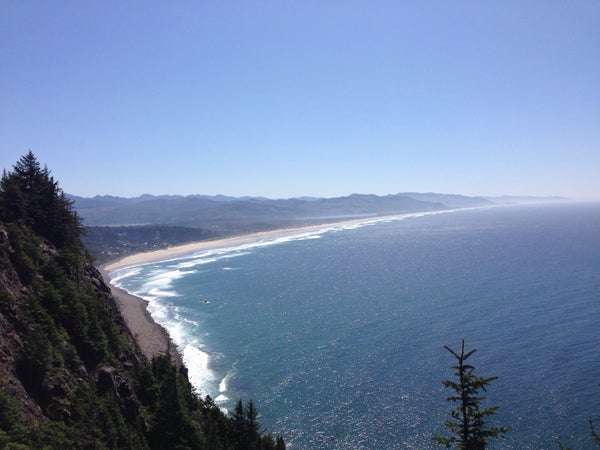
Manzanita Beach
9.3
Beach -
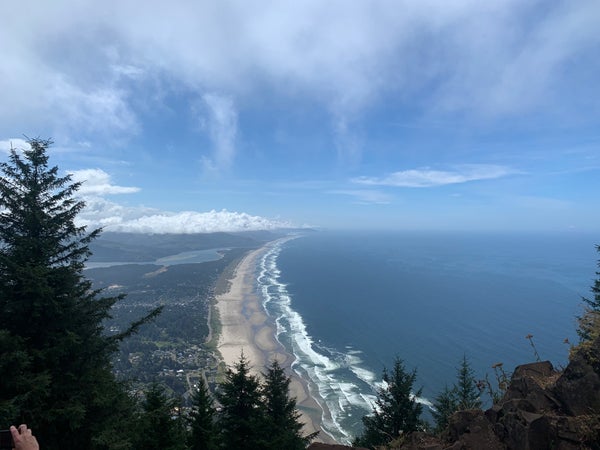
 Scenic Lookout
 -
 Scenic Lookout
 -
State or Provincial Park
-
 Campground
 -
 Mountain
 -
 Harbor or Marina
 -
 Beach
Beach -
 Campground
 -

Arch Cape
7.7
Beach -
 Historic and Protected Site
 -
Historic and Protected Site
-
Scenic Lookout
-
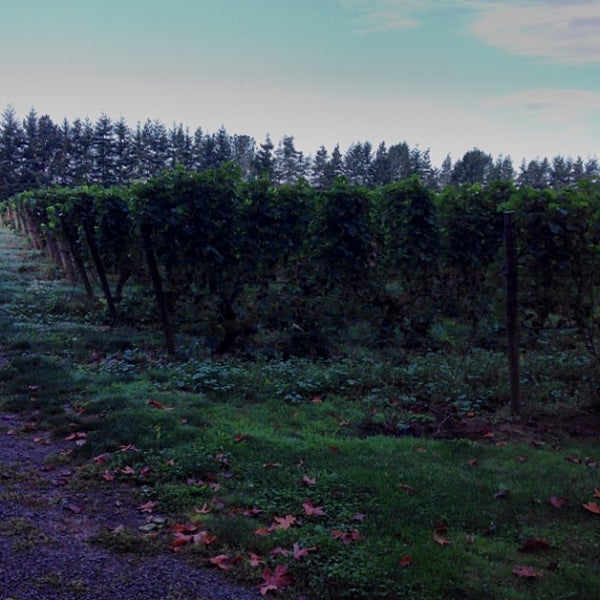 Winery
 -
 Motel
Motel -
 Historic and Protected Site
 -
Landmark Saloon
7.6
Bar -
 Resort


![%=topPerformingBlogs[i].title%>](https://images.mashvisor.com/40X40/C/https://www.mashvisor.com/blog/wp-content/uploads/2024/03/Vacation-Rental-Marketing-585x390.jpeg)
![%=topPerformingBlogs[i].title%>](https://images.mashvisor.com/40X40/C/https://www.mashvisor.com/blog/wp-content/uploads/2024/03/Airbnb-Amenities-585x390.jpeg)
![%=topPerformingBlogs[i].title%>](https://images.mashvisor.com/40X40/C/https://www.mashvisor.com/blog/wp-content/uploads/2024/03/Choosing-Vacation-Rental-Software-585x390.jpeg)


