Airbnb growth trends drive where and how much short-term rental investors earn.
In 2025, knowing the numbers is non-negotiable. Our latest snapshot shows the US average Airbnb occupancy dipping to about 50%, down 7 points from last year, as new listings outpace demand.
Yet nightly prices keep climbing. CBRE reports “strong rate growth”, and those higher rates pushed Airbnb RevPAR (revenue per available rental) up 8.1% year over year in January.
Behind the math, guest behavior has flipped again. Remote work still fuels longer, mid-week “bleisure” stays, but travelers are booking later and hunting for value after two years of inflation-driven splurges.
These shifts create sharp winners and losers: some small cities now fill 70% of nights, while oversupplied beach towns sit half-empty.
To cut through the noise, this guide unpacks the seven forces reshaping 2025 returns:
- Normalizing occupancy rates
- Sticky, but moderating, average daily rates (ADR)
- Secondary markets stealing the spotlight
- The comeback of business and group travel
- Tighter rules in core metros
- AI-powered revenue management
- Sustainability as a booking filter
Each section pulls from Mashvisor’s live database of over 10 million listings, government tourism dashboards, and industry outlooks, so every insight is based on real, current data.
Read on, and you’ll learn how to:
- Spot neighborhoods that beat the 55% “good” occupancy bar
- Price nights to ride demand spikes without crushing fill rates
- Flag regulatory red zones before they erode ROI
Master these trends now, and every deal you screen in 2025 starts with a sharper edge.
Key Takeaways
- Supply is outpacing demand in many big hubs, dropping the national Airbnb occupancy rate to ~50% while ADR still sits almost 25% above last year.
- Opportunity is shifting to data-backed niches. Secondary cities, mid-week business stays, and eco-labeled listings now deliver the most substantial gains.
- Regulation and tech now decide winners and losers.
Trend #1: Occupancy Rates Are Normalizing Amid Oversupply
After two years of record bookings, one of the clearest Airbnb growth trends of 2025 is a cooling Airbnb occupancy rate nationwide. Our spring snapshot pegs the US average at ~50%, down from 57% in 2024, as hosts list properties faster than demand can absorb them.
Because the bar has dropped, analysts now label 55%+ occupancy “good” performance, a realistic yet competitive benchmark investors should aim to beat through dynamic pricing, sharper photos, and amenity upgrades.
The gap between winners and losers is widening. Tight-knit, commuter-friendly pockets like Whittier and Westminster, CA, are hitting 86% occupancy, proving that smaller cities can outperform big-name vacation hubs.
Meanwhile, traditional beach destinations feeling the weight of new inventory and stricter regulations (Ocean City, MD sits below 35%) highlight the risk of chasing brand-name markets without fresh data.
Before you start investing or expand your business, zero in on sub-markets consistently posting 55%+ occupancy and confirm that Airbnb average daily rate (ADR) growth is strong enough to keep RevPAR rising. In practice, that means:
- Pulling Mashvisor comps to compare current ADR and occupancy against last year.
- Stress-testing returns at 5-10% lower occupancy in case more listings hit the market.
- Layering in a dynamic pricing tool and value-added amenities (fast Wi-Fi, pet-friendly setups) to climb above the 55% line.
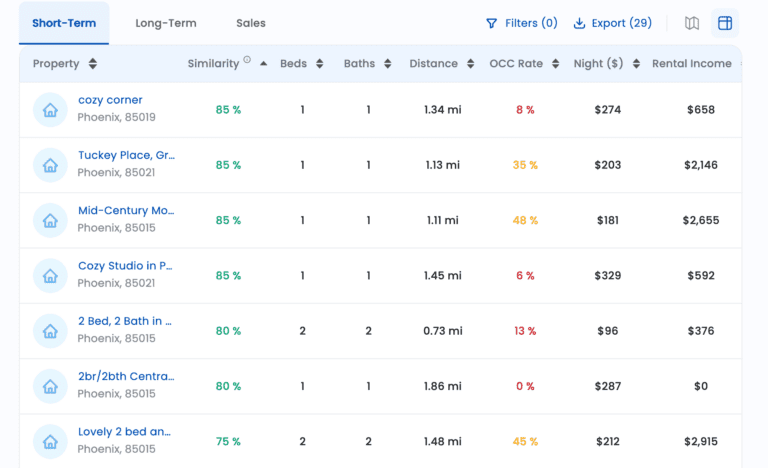
Short-term comps table, which you can find in every property details page
Staying disciplined on these fundamentals turns a cooling market into a chance to scoop up properties the data still favors, while others chase yesterday’s hotspots.
Trend #2: ADR Inflation Slows But Stays Elevated
The second headline Airbnb growth trend of 2025 is price fatigue, not price collapse.
From 2020 to 2024, average daily rates (ADR) sprinted ahead at 30%+ clips each year as pent-up travel demand met tight supply. This year, the pace has cooled, but don’t be fooled: our proprietary dataset shows the national ADR still jumped 24.88% year-on-year between May 2024 and May 2025.
With US consumer inflation hovering near 2.3%, nightly rates remain far above the cost-of-living curve, propping up Airbnb RevPAR even as occupancy normalizes.
The gap between premium and mainstream markets is widening:
- Rancho Palos Verdes, CA – $817 ADR (35% occupancy)
- Kapolei, HI – $515 ADR (61% occupancy)
- Deerfield Beach, FL – $242 ADR (60% occupancy)
All three destinations are still raising rates faster than CPI, powered by high-spending leisure travelers and resilient domestic demand, even though inbound traffic is soft in early 2025.
That dip hasn’t dented premium coastal pricing power, but it has pushed many mid-tier suburbs and oversupplied resort towns to trim prices to keep calendars full, proving that today’s ADR strength is hyper-local.
If you want to keep your RevPAR the same as (or higher than) last year, consider building a tiered pricing calendar.
- Peak-event tier: Post premium rates 9-12 months out for festivals, holidays, and big-ticket sports weekends.
- Shoulder-season tier: Keep prices 5-10% above nearby comps while rivals discount, but sweeten the deal with extras like free parking or early check-in instead of cutting night rates.
- Off-peak tier: Offer modest multi-night and weekly discounts that fill gaps without wiping out margin.
Automating these tiers in our dynamic pricing engine lets you pivot the moment ADR—or inflation—shifts, protecting your cash flow now and buffering against any further plateaus through the rest of 2025.
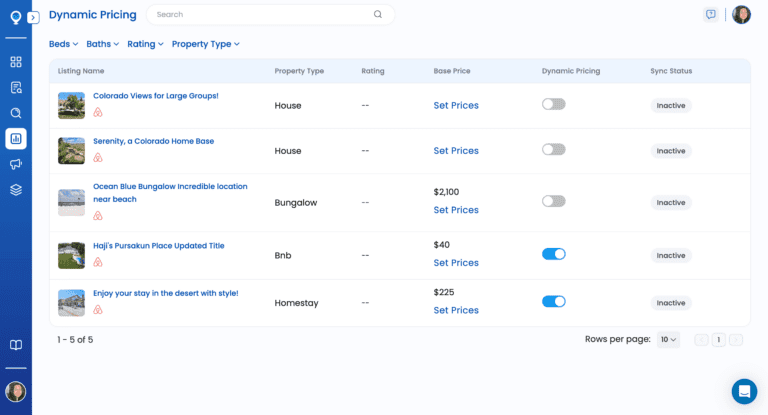
Mashvisor’s Dynamic Pricing tool
Trend #3: Secondary & Tertiary Cities Surge
One of the most notable Airbnb growth trends of 2025 is the rapid rise of secondary and tertiary cities as popular short-term rental (STR) hubs. Smaller cities like San Gabriel, CA, Davenport, FL, and Winter Haven, FL, are seeing explosive growth in short-term rental demand.
San Gabriel, boosted by new additional dwelling unit (ADU) rules near Los Angeles, has seen a remarkable 709% surge in listings year over year.
Davenport, positioned just minutes from Disney World, experienced a 707% rise, driven largely by affordable housing and proximity to major tourist attractions.
Winter Haven, known for balancing new supply with steady guest demand, is emerging as a “goldilocks” market where investors find strong occupancy and rising returns.
Several key factors are fueling this surge:
- Affordable housing: These cities offer lower property prices than major metropolitan areas, attracting investors seeking higher returns.
- Local tourism boards: Promoting local attractions and events actively boosts visitor numbers and short-term rental demand.
- Remote work hubs: The rise of remote work has led to increased demand for mid-term stays in smaller cities offering a better quality of life.
If you’re looking for your first or next Airbnb, scout undervalued zip codes in these markets before they become saturated. Tools like Mashvisor’s analytics platform can quickly pinpoint neighborhoods with high occupancy, strong ADR growth, and favorable revenue potential.
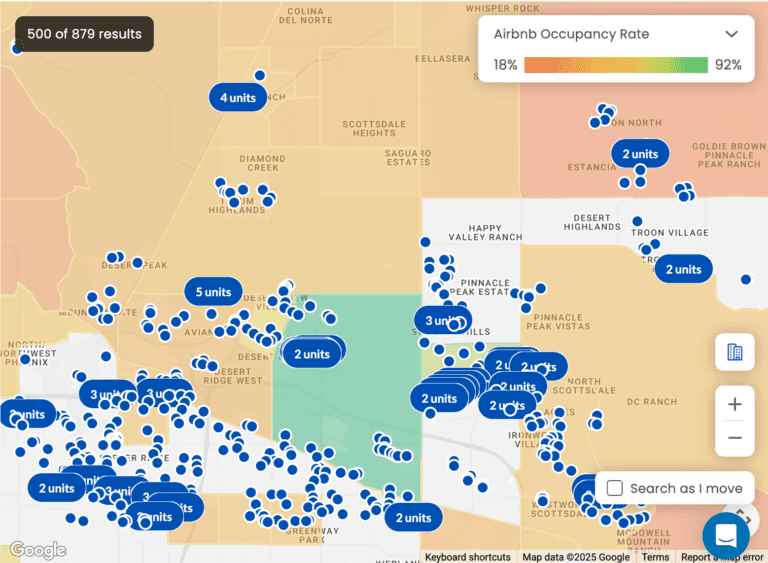
Use Mashvisor’s heatmap to find neighborhoods with high Airbnb occupancy rate, rental revenue, cash-on-cash return, and more
By targeting these emerging locations early, you can ride this wave of increased demand and capitalize on the steady growth of secondary and tertiary markets.
Trend #4: Return of Business & Group Travel
A significant Airbnb growth trend in 2025 is the resurgence of business and group travel, reshaping the STR market outlook.
After a period dominated by leisure stays, corporate bookings have rebounded significantly. Airbnb’s market share rose from 28% in 2019 to 44% in 2024, indicating a growing preference among business travelers for short-term rentals.
This shift is evident in the rise of midweek occupancy rates, as business travelers often book stays from Monday to Thursday. Properties offering corporate-friendly amenities—such as high-speed Wi-Fi, dedicated workspaces, and self-check-in options—are experiencing increased demand.
To capitalize on this trend, consider doing the following:
- Workspace upgrades: Equip your property with ergonomic chairs, spacious desks, and ample lighting to cater to remote workers and business travelers.
- Flexible cancellation policies: Business plans can change unexpectedly. Offering flexible cancellation options can make your listing more appealing to corporate guests.
- Professional listings: In your listing description and photos, highlight amenities tailored to business travelers. For example, emphasize features like proximity to business districts, conference centers, and transportation hubs.
Adapting to the evolving needs of business and group travelers can help ensure sustained bookings and revenue growth throughout the year.
Trend #5: Regulatory Tightening in Core Markets
Another noteworthy Airbnb growth trend in 2025 is the tightening short-term rental regulations in major US cities, notably New York City, Los Angeles, and Honolulu. These changes are reshaping the landscape for hosts and investors in top Airbnb markets.
In New York City, the enforcement of Local Law 18 has led to a dramatic reduction in STR listings. The law requires hosts to register with the city’s Office of Special Enforcement and be present during guest stays. As a result, the number of available STRs has plummeted, impacting both supply and pricing dynamics.
Meanwhile, Los Angeles imposes a 120-night annual cap on unhosted short-term rentals. Hosts wishing to exceed this limit must apply for an Extended Home-Sharing permit, which involves additional requirements and fees. Additionally, a 14% Transient Occupancy Tax (TOT) applies to bookings of 30 days or fewer.
And in Honolulu, recent legislation has increased the hotel room and vacation rental tax to generate revenue for climate change mitigation efforts. Starting January 1, 2026, the tax will rise by 0.75%, bringing the total accommodation tax to nearly 14%.
These regulatory changes can reduce STR supply, potentially increasing nightly rates due to scarcity. However, they also introduce complexities that can affect property values and profitability.
So if you want to keep your Airbnb business running smoothly, make sure to:
- Register with local authorities as required.
- Understand and adhere to local caps on rental days.
- Collect and remit all applicable taxes.
- Stay informed about zoning laws and permit requirements.
Navigating these regulations is crucial for success in top Airbnb markets. Staying compliant not only avoids penalties but also positions your property favorably in a competitive landscape.
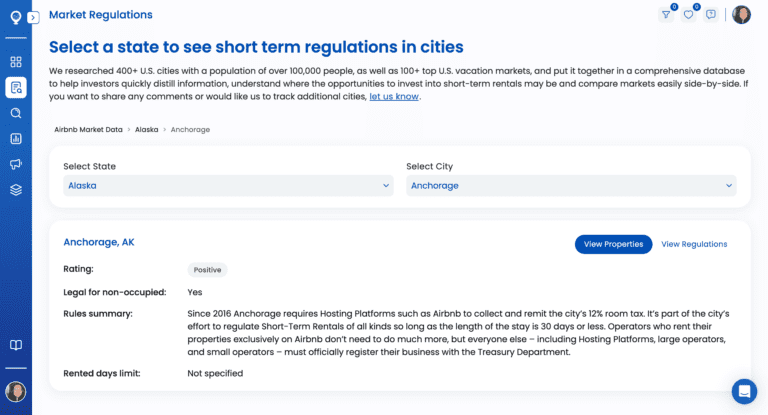
Mashvisor has a page for looking up the latest short-term regulations in 400+ US cities
Trend #6: Tech-Enabled Revenue Management
A standout Airbnb growth trend in 2025 is the widespread adoption of AI-driven revenue management tools. Over 70% of STR operators now use artificial intelligence, particularly for dynamic pricing and automation.
AI-powered dynamic pricing systems analyze numerous variables, such as local events, weather patterns, and competitor rates, in real time. This enables hosts to adjust nightly rates dynamically, optimizing occupancy and revenue.
Simultaneously, there’s a notable shift towards direct bookings, reducing reliance on Online Travel Agencies (OTAs) and their associated fees. By encouraging guests to book directly, hosts can increase profitability and foster stronger guest relationships.
Integrating a vacation rental software with revenue management tools can yield significant benefits. This combination allows for automated pricing adjustments, streamlined operations, and enhanced guest experiences. Implementing such a tech stack can lead to an 8-12% increase in revenue, making it a calculated move for any Airbnb investment strategy.
In the competitive landscape of 2025, leveraging technology is not just advantageous; it’s essential. By embracing AI-driven revenue management and direct booking strategies, you can optimize your operations, increase profitability, and stay ahead in the evolving STR market.
Trend #7: Sustainability Becomes a Booking Filter
Finally, eco-friendly stays have moved from nice-to-have to deal-breaker, making green upgrades one of the most powerful Airbnb growth trends of 2025.
Three-quarters of global travelers now “want to travel more sustainably” over the next 12 months, with 57% actively looking to cut their energy use while on the road. Expedia’s own research shows a parallel jump in guests filtering search results for sustainable options.
That shift is rewriting booking algorithms: listings that flaunt eco credentials are surfacing higher and converting faster across major channels.
The payoff is real. MDPI reports that well-executed green upgrades command at least 5% higher nightly rates than comparable non-certified homes. At the same time, LEED-labeled hotels average a $169 ADR versus $160 for standard properties, a 6% premium that travelers willingly pay.
Platforms like Sustonica now offer STR-specific specifications, giving hosts a badge that both justifies the rate bump and boosts search rank. As more owners chase these badges, early adopters lock in higher ADR before the market catches up.
The math on upgrades is compelling. Adding rooftop solar can raise a property’s resale value by 4-5% and slash utility costs enough to repay itself in under eight years in sun-belt markets. Low-flow faucets and toilets trim water use up to 32%, paying back their modest cost within two peak seasons.
Stack those savings on top of a 5% ADR premium, and you can lift your net income by 10% or more, all while meeting rising guest expectations and future-proofing your Airbnb investment strategy.
Conclusion
The seven Airbnb growth trends outlined here redraw the 2025 playbook.
Normalizing occupancy, still-elevated ADR, explosive supply in emerging cities, a rebound in business travel, more burdensome short-term rental regulations, AI-powered pricing, and rising demand for sustainable stays together shift both risk and reward.
Key numbers—~50% national occupancy, a 24.88% ADR jump, 700% listing spikes in some secondary markets, and city-level caps and taxes—show why static forecasts no longer work.
The smartest path forward is dynamic: run market-level scenarios in Mashvisor’s analytics suite, test multiple occupancy and pricing cases, and model regulatory costs before you buy. Sign up today and capitalize on 2025’s short-term rental upswing.