AirDNA market data and Mashvisor data are two popular options for real estate investors looking to gain insights into property values.
When you embark on a new investment strategy, it makes sense to find out as much information as possible before signing on the dotted line. A great way to uncover more about your options is by taking advantage of investment property analysis.
Table of Contents
- How Does AirDNA Provide Airbnb Market Data?
- How Does Mashvisor Provide Airbnb Market Data?
- AirDNA vs Mashvisor: Is Mashvisor Better Than AirDNA?
- AirDNA Market Data vs. Mashvisor Data: Final Thoughts
If you’re thinking about investing in short term rentals because you like the idea of becoming an Airbnb host, you need to look for the best Airbnb analytics platform. With the right tools and investment property analysis, you’re better equipped to create your real estate investment strategy.
There are plenty of avenues to explore, but in this post, we’re going to compare two of the most popular sources: AirDNA vs. Mashvisor.
AirDNA market data and Mashvisor data are two leading sources of real estate insights for investors. While AirDNA is known for its comprehensive analysis of Airbnb data, Mashvisor offers AI-powered tools for traditional rental properties.
Each platform comes with its own unique features and benefits, making them valuable resources for investors looking to make informed decisions.
How Does AirDNA Provide Airbnb Market Data?
AirDNA collects vacation rental data from thousands of sources. They include private hosts and strategic API partnerships with several large property management companies, to build a comprehensive view of the short term rental market.
AirDNA tracks Airbnb and Vrbo data and offers AI-powered tools that allow for the accurate identification of unavailable days and blocks. It is done by analyzing 16 different booking signals, such as the length of stay and how far in advance the booking is made. The booked vs. blocked methodology used by AirDNA is extremely accurate, which makes the platform a valuable resource for real estate investors.
One of AirDNA’s best features is the depth of data they offer to real estate investors. It offers property-specific analysis that allows real estate investors a glimpse into the way that others are running their Airbnbs.
AirDNA provides detailed information on its data sources, coverage, and accuracy. The company claims to provide the most comprehensive and accurate vacation rental data and analysis around the globe. However, some customers have pointed out major data issues with the platform, including the fact that it can only estimate bookings if it lacks inside access to Airbnb.
AirDNA Services
AirDNA offers two main services: Market Minder and Investment Explorer.
Market Minder
MarketMinder is a web app that provides various metrics for Airbnb rentals around the world. Using the AirDNA market data, you can better understand a local market or research much further afield. It is a paid-for service that is charged on a per-neighborhood basis.
The tool provides insights into the performance of over 10 million vacation rentals across 120,000 global markets, making it a comprehensive source of market data and trends.
MarketMinder offers multiple ways to analyze revenue performance, including grouped percentiles and the number of bedrooms, which can help refine research and identify historical market patterns. With a free account, users can view market research metrics in the overview tab, including average daily rate, occupancy rate, revenue, and more location-specific market metrics.
MarketMinder gathers information from the public websites of Airbnb and VRBO using the so-called scraping method. By analyzing historical Airbnb data, MarketMinder allows users to look back over market trends and conditions in the last three years and explore the number of active rentals, occupancy, and rate.
Investment Explorer
Investment Explorer is also a web app, but in this case, it combines Airbnb analytics and data with home value data. It can give you AirDNA market data for more than 750,000 properties in the United States. You can decide on the most profitable short term rental investment location using the data. This service is also subscription-based.
The tool provides benchmark rental performance data from over 4,000 cities in the United States and allows users to see how much full-time Airbnbs are making in different areas.
AirDNA’s Investment Explorer account allows potential real estate investors to view different markets across the US and see which areas are profitable in terms of revenue from short term rentals.
The tool provides granular insights behind the industry’s biggest trends, from property-level data to trend reports and future-looking forecasts. Users can use the tool to make better predictions based on the available data in a specific market.
AirDNA Pricing
AirDNA market data offers a subscription-based pricing system, with different price ranges based on locale. According to its website, a real estate investor will need to pay $12 per month to search for properties in cities and neighborhoods. It is a great plan for hosts and real estate investors.
The next tier of pricing is state-wide. Here, the investor must pay $179 per month. The state-wide plan is great for real estate investors and professionals.
To search for properties around the country, AirDNA will charge you $299 per month. The plan is adequate for real estate investors. Then, for global searches, you will pay $599 per month.
How Does Mashvisor Provide Airbnb Market Data?
So, what about Mashvisor and the tools it offers?
Mashvisor uses a range of data sources to gather information about Airbnb markets across the US. It includes data from Airbnb itself, as well as those from various other sources, such as property listing websites, public records, and other real estate marketplaces. The said data is then analyzed and processed using machine learning algorithms to identify trends and patterns in the market.
If you are new to real estate investing, you might be struggling to know where to start. Of course, you want the best rental property, but how do you go about looking?
The most obvious place to start for first-time investors is in their neighborhood. However, it is not necessarily the best place because there’s often a wealth of opportunities out of state. Quite often, out-of-state properties will be more affordable and offer a higher return on investment.
The best real estate software platform will be one that provides investors with the option to conduct a nationwide property search as efficiently as possible.
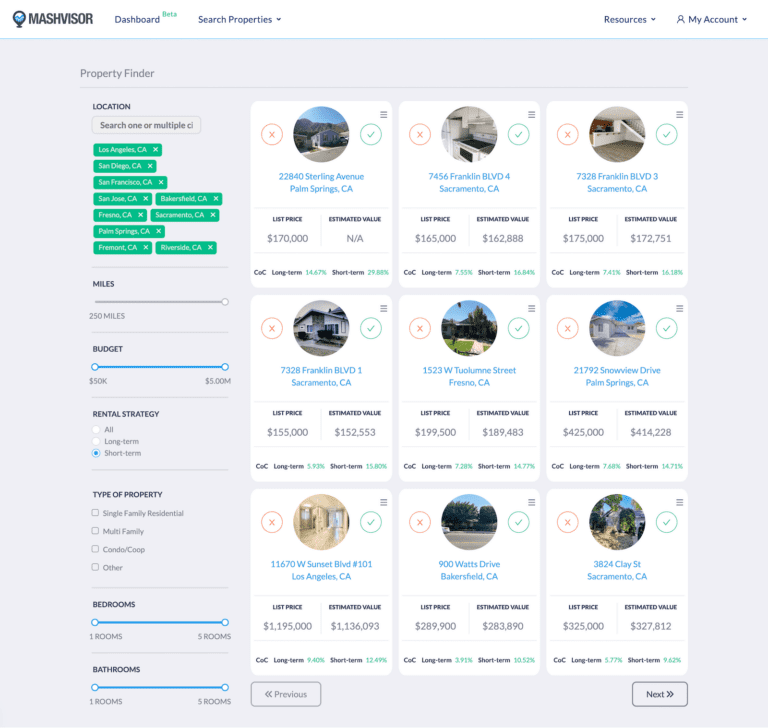
The Mashvisor team developed a tool you can use for this purpose: the Property Finder.
Property Finder
One of the main ways that Mashvisor provides Airbnb market data is through its Property Finder tool.
The tool allows investors to search for properties in specific locations and view detailed information about the rental market in that area. It includes data on rental income, occupancy rates, rental expenses, and more. With the said information, investors can quickly and easily evaluate the potential profitability of a property and make informed investment decisions.
Property Finder is a Mashvisor tool suitable for both beginners and more experienced property investors alike. It allows you to look for the most profitable Airbnb investment properties for sale. You can search in up to 10 markets simultaneously, and you can narrow down your search with the help of several filters. The filters include:
- Location (you can search in multiple cities in the US housing market simultaneously)
- Rental strategy (short or long-term rental)
- Property type
- Property price
- Number of bathrooms
- Number of bedrooms
With Mashvisor’s Market Finder, aspiring Airbnb rental investors can search for potentially profitable properties in up to 10 markets at once.
The software uses machine-learning algorithms to search for rental properties that match your requirements. Then, to make things more convenient for you, the software sorts the properties in descending order of Airbnb cash on cash return. At the top of the search results, you’ll find short term rental properties that will bring the highest rate of return.
Detailed analysis is also available relating to the investment potential of each of the properties in your search results.
Does AirDNA Offer a Short Term Rental Property Search?
AirDNA does not offer a short term rental property search engine. However, it does provide a suite of custom data products and analytics tools to help property owners and investors make data-driven decisions in the short term rental market.
AirDNA collects short term vacation rental data from various sources, including Airbnb, Vrbo/HomeAway, private hosts, and strategic API partnerships with property management companies. It offers a suite of custom data products tailored to the needs of its clients, including property-level data, trend reports, and future-looking forecasts.
As mentioned above, its Market Minder tool provides insights into properties listed on Airbnb and Vrbo, allowing users to optimize their pricing strategies and maximize income.
While AirDNA does not offer a short term rental property search engine, Mashvisor is a platform that offers a Property Finder search engine to help investors find properties for sale. However, Mashvisor’s coverage is limited to the United States.
Start your 7-day free trial today with Mashvisor’s Property Finder tool.
Rental Property Analysis
AirDNA market data tools and Mashvisor tools are both Airbnb analytics platforms. However, it is important to point out some significant differences.
Mortgage Calculator
One major difference between the two is the availability of a mortgage calculator. AirDNA market data tools do not feature a mortgage calculator, whereas Mashvisor tools include one.
Using a mortgage calculator, you can do a more detailed analysis of your property investment and consider your financing method. You can expect very different results in terms of return on investment, depending on whether you pay cash for your real estate investment or use a mortgage.
With the Mashvisor rental property calculator, you can precisely determine what return you’ll get on the cash you spend purchasing your property and then renting it out. Estimates for the cash on cash return for Airbnb properties are not something the AirDNA market data provides.
Rental Comps
Another critical factor for any kind of real estate investment analysis is comparing rentals. By looking at how similar Airbnb properties perform, you can gauge how your short term rental will perform.
Mashvisor and AirDNA offer lists of Airbnb rental comps for each analyzed property. However, the list from Mashvisor is much longer and more comprehensive.
The Mashvisor tools also provide Airbnb occupancy rate data. You can also download the list and analyze the data at your own pace and in your own time.
How Accurate is the Airbnb Data?
Any analytics platform is only as good as the data it collects and analyzes. It is especially true when it comes to real estate investing. So, where do Mashvisor and AirDNA get their market data from?
The data source is one area where the two are similar, as they both get the majority of their short term rental data directly from Airbnb itself.
There’s no guesswork or approximations involved because the analysis is based on the performance of bona fide Airbnb properties.
That being said, the difference is in the methods each platform uses to obtain average values. For example, AirDNA market data is calculated using the mean, whereas Mashvisor uses the median.
But what difference does that make? The Mashvisor approach is a more accurate one. It’s also more robust and reliable. It is because the median eliminates outliers (data points that differ significantly from other observations). Outliers can cause serious problems in statistical analyses. They have the potential to misinform and skew the analysis.
Mashvisor data is also more accurate for other reasons:
- Only uses verified Airbnb listings with three or more Airbnb reviews
- Ensures the data comes from actual Airbnb hosts who’ve been renting out for a while
- Doesn’t include homeowners who tried Airbnb but didn’t like it
One final difference is in the accuracy and reliability of the data. Mashvisor pulls the property data directly from the MLS, which is a reliable and accurate source. AirDNA, on the other hand, gathers its data from public records, which are known for featuring a certain degree of error.
Rental Strategies
When you invest in real estate, there are several rental strategies you can adopt. For example, you can go down the short term rental route through Airbnb. Alternatively, you might choose to rent out your property on a long term basis, which is the more traditional rental.
Both AirDNA and Mashvisor cater to the short term rental strategy. However, Mashvisor also supports a long term rental strategy.
Being able to analyze both short and long term rental strategies is one of the most significant advantages of the Mashvisor tools. You may have your mind set on short term rentals and Airbnb properties, but it’s always a good idea to look at your real estate investment property from other angles.
Let’s take a look at a couple of reasons why you shouldn’t disregard the long term rental strategy.
Regulations and Restrictions
While Airbnb rentals generate a higher return on investment, on average, they are often subject to stricter restrictions and regulations. For example, in some areas in the United States, short term rentals are restricted or even prohibited.
The property you buy today may be in an area where Airbnb is legal. But who knows what will happen a week, a month, or a year from now. You may need to switch your rental strategy to stay on the right side of the restrictions.
Is Short Term Rental Right for You?
People often think that being an Airbnb host will be a walk in the park, but that’s not true. Such type of short term rental strategy can be a lot of hard work. You might think you’ve picked the right rental strategy, but it might not be suitable for you.
Of course, there’s the option of hiring an Airbnb management company, but that will come at a cost. A few months down the line, if you decide that Airbnb rentals are not for you, Mashvisor tools can help you with a new long term rental strategy.
You could find yourself facing either of the said scenarios, so it helps if you can search for a property that offers an above-average rate of return for both strategies.
Pricing
The final aspect to consider when comparing AirDNA vs. Mashvisor is the cost of both options.
One advantage of AirDNA is that some of its data are available for free. However, it won’t be long before you realize you’ve not got enough information to make your real estate investment decisions.
Another downside with AirDNA pricing is that you need to pay for each city market individually. If you’re not 100% certain of the area where you want to invest, or you need to compare several markets, AirDNA can work out to be very expensive.
Mashvisor, on the other hand, may not offer any free options, but when you’re searching for and analyzing properties across the country, it works out to be more affordable.
What Other Tools Are Available From Mashvisor?
Mashvisor offers a range of other useful tools for property investors. Here are some more examples of what’s available:
Investment Property Calculator
With the investment property calculator, you can determine the cash flow and profits that an income property can generate. The most up-to-date data and trends are used for the analysis, and you can also input data for a highly accurate estimate.
The Real Estate Heatmap
You can use the heatmap tool to conduct neighborhood analysis and hone in on markets it would be profitable to invest in.
The real estate heatmap tool creates a map that identifies areas with the most affordable listing prices. It also highlights areas with the highest rental income and cash on cash return and shares Airbnb occupancy rate data.
Neighborhood Analytics
Mashvisor offers a neighborhood analytics page that provides valuable information for real estate investors looking for investment properties in their city of choice. Because Mashvisor obtains its data from reliable sources like MLS, Airbnb, Redfin, and others, it is able to make accurate projections for nationwide areas.
The Neighborhood Analytics page offers data and stats related to the chosen neighborhood. They include the Mashmeter Score, Median Price, Traditional and Airbnb Cash on Cash Return, and Traditional and Airbnb Cap Rate. You can quickly view all the stats and averages of the neighborhood that you chose from the top side of the screen.
Mashvisor’s Neighborhood Analytics page provides essential information to investors to make informed decisions and estimate potential returns on investment before purchasing a property.
Real Estate Agent Directory
There may come a time when you want or need to sell your real estate investment, and it’s always advisable to use the services of a real estate agent. The real estate professional will help facilitate the process, but how do you go about finding the best one?
Mashvisor’s comprehensive real estate directory can help you find an agent in any US housing market, no matter how big or small. You’ll find the following information in the directory:
- Name
- Phone number
- Real estate website
- Overview
- Real estate license
- Real estate experience
- Areas served
- Agent specialties
- Agent experience
- Office agents
- Real estate blog posts
- Active listings
- Off market properties
AirDNA vs Mashvisor: Is Mashvisor Better Than AirDNA?
For more information about the AirDNA vs Mashvisor comparison, check out the video below:
AirDNA Market Data vs. Mashvisor Data: Final Thoughts
AirDNA market data and Mashvisor data are two of the most popular real estate data analysis tools on the market today. After going through the information you just got, it’s clear that both platforms offer unique features that cater to different types of investors.
One of the most significant differences between AirDNA and Mashvisor is their focus. AirDNA primarily caters to short term rental investors, while Mashvisor offers tools for both short term and long term rentals. Additionally, Mashvisor provides a mortgage calculator, which is not available on AirDNA.
Additionally, some reviews indicate that Mashvisor provides more detailed information on various metrics, such as booking lead time and property-level future pricing data.
Regarding pricing, both platforms offer multiple plans, catering to different levels of access and needs. Mashvisor’s plans range from $22.99 to $99.99 per month, while AirDNA’s plans range from $12 to $599 per month.
You’ve now got all the information you need to help you make an informed decision about the best Airbnb analytics platform. If you think Mashvisor has everything you need and more, a free trial is available, so why not sign up right away?