Are you thinking of buying investment rental properties in 2024? Here is a list of some of the best places to invest in real estate this year.
It is something that has been on the mind of a lot of real estate investors who are always on the lookout for the most profitable investment opportunities. However, it’s not always that easy to find the best investment property places without putting in the work. And a lot of it has to do with keeping yourself updated with actual market conditions.
Table of Contents
- Characteristics of Best Places to Invest in Real Estate
- 20 Best Places to Invest in Real Estate for Long Term Rentals in 2024
- 20 Best Places to Invest in Real Estate for Vacation Rentals in 2024
- How to Find the Best Places to Invest in Real Estate in 2024
- 5 Tips for Real Estate Investing
As a real estate investor, performing due diligence is a surefire way of getting optimal returns on your investment. You need to do hours of research and analysis to help you with your projections and calculations.
The good news is that you can make things easier by following Mashvisor’s blog. We regularly give you useful investment information and advice, especially on the best locations for investment property.
That being said, this article will show you which places are worth checking out for both long and short term rental properties in 2024. More than just showing you excellent investment locations, we will also give you a few tips on staying ahead of the real estate investing game.
So if you’re in the market looking for the best place to buy a rental property in 2024, keep reading.
Characteristics of Best Places to Invest in Real Estate
When looking for a great location to invest in rental properties, the first step should be learning how to identify what characteristics the best place to invest in real estate in 2024 demonstrates.
Remember, you can always change some of your property’s features and carry out major upgrades and renovations, but you’re stuck with your investment location until you decide to offload your investment. This is why you must choose your location carefully.
Most real estate investors have their own criteria when looking for cities to invest in. But investing in the fastest growing city isn’t enough.
Let’s look at common characteristics of suitable locations for both long and short term rental locations:
Long Term Rental Locations
Here are some characteristics of great locations for long term rental properties:
Low Unemployment Rate
Rental properties are profitable when you invest in locations where the residents can afford to pay rent. Great investment locations for rental properties have high employment and job growth rates.
Seek to understand the number of big employers in a city you’re interested in. Avoid investing in a place with only one big employer. What could happen to your investment if the only employer in your area shut down or moved operations to another city?
Many employers mean that the city’s economy is booming. It also means that the local population can find employment fast and earn a consistent income to pay their bills.
Basically, consider the following factors when looking for a city with low unemployment rates:
- Job growth rate
- Median salary
- Types of jobs available
- Number of large employers
It’s important to note that not many cities tick all the boxes. Find a location that offers a perfect balance of all the factors.
Your best bet is with a city whose unemployment rate is lower than the national average.
High Appreciation Rates
There are many ways to measure a property’s profitability. One common way is estimating how much cash flow the property will give you every month. The other way that’s often overlooked is the property’s value appreciation in the long term.
Many factors influence a property’s appreciation rate. Some of them have to do with the property itself. They include the property’s size, age, condition, features, upgrades, and renovations.
The other factors, which are the most important ones, are determined by the location. For example, a property located in a high-growth area with a lot of upcoming developments will experience a higher appreciation rate compared to properties in dormant cities.
Some factors specific to the neighborhood also determine whether your property appreciates. Properties in a secure neighborhood will appreciate more than properties in an area with high crime rates.
As you can tell, the best places to buy rental property in 2024 have high property appreciation rates.
Population Growth
An excellent location for buying investment property experiences a good population growth rate through both natural growth and immigration.
Consider a city’s population and look at whether it’s growing or declining before investing. A growing population means that demand for housing will increase.
Population growth is intertwined with low unemployment. Cities with the availability of jobs experience immigration as people from other states and cities move in to look for opportunities. Those who succeed settle in the city and look for housing.
Other factors influencing population growth include good weather, friendly government policies, and affordable cost of living.
Low Housing Supply & High Demand
The best places to buy investment property in 2024 have a low supply of rental properties but a high demand. Purchasing a rental property in such a location means you get to experience low tenant turnover and high rental rates since competition is low.
Keep in mind that while a city may have a low supply of rental properties now, there may be upcoming developments that change the situation in the near future.
Also, a low housing supply doesn’t necessarily give you the green light to invest in the city. There may be other factors that make the location less desirable for investment.
Find a city with a perfect balance between low supply and high demand for housing.
Moderate Price-to-Rent Ratio
There are many metrics to consider before investing in any location. One of them is the price-to-rent ratio.
Simply put, the price-to-rent ratio tells you whether it’s ideal to buy or rent in a particular market. A low ratio means people would prefer buying to renting. A high ratio means that property buying prices are higher than rental rates, so residents would prefer renting.
Here’s a breakdown of different price-to-rent ratios and what they mean:
- 1-15: Buying a property is better than renting
- 16-20: There’s a balance between home prices and rental rates
- 21+: Renting may be better instead of buying a home
While a high ratio may mean your rental property will experience increased demand, be careful with locations with ratios that are too high. When property prices are incredibly high, it’ll take a long time to recoup your investment.
Availability of Amenities
Traditional amenities boost a rental property’s appeal, demand, and, ultimately, return on investment. Cities that make for great investment locations have good schools, parks, grocery stores, restaurants, health facilities, and other amenities that boost residents’ convenience.
These amenities can also influence your target tenants. If you’re investing in a college town, you can use your investment as a student rental.
Public Transport
Great locations for rental property investment are easily accessible either by air or by road. A central transportation hub is an asset when looking for a good location to invest in.
Good transportation hubs provide easier access to the city center, commercial and residential areas, other cities, and amenities. It is a huge plus for residents who commute to and from work and school, as well as those who prioritize entertainment.
Short Term Rental Locations
What should you look out for if you’re interested in short term rental properties? Here are some characteristics of great locations for these investments:
Tourist Attractions
The short term rental industry is highly dependent on the tourism industry. Great short term rental locations are near popular tourist attractions.
Think of cities near national parks, mountains, lakes, beaches, hiking trails, wildlife sanctuaries, amusement parks, and basically anything that would attract outdoor lovers.
Don’t forget cultural and historical attractions, such as museums, archaeological treasures, landmarks, religious venues, monuments, and science centers.
As an Airbnb host, you should find out what your guests are attracted to in your city and tailor your short term rental to suit them.
Favorable Airbnb Regulations
One of the most important characteristics of good locations for short term rental investment is favorable short term rental laws and regulations. Seek to find out whether your city has Airbnb ordinances, what you’re required to do to operate an Airbnb legally, and the legal implications of not adhering.
Airbnb regulations vary from city to city. Some local authorities have banned Airbnb rentals in their cities, while others have strict rules that hosts must adhere to. Others have a limit on the number of guests you can host and the maximum number of nights you can lease out your property as an Airbnb rental in a year.
Seek to find out what permits, licenses, taxes, and zoning regulations you’ll have to abide by.
Other than the local authority regulations, seek to find out whether there could be any limits specific to your neighborhood. Some Homeowners Associations (HOAs) have their own custom regulations that hosts must comply with.
Be aware of any developing legislation that may affect your short term rental down the line.
20 Best Places to Invest in Real Estate for Long Term Rentals in 2024
If you’re looking to buy an investment property in the US, here are 20 of the best places for purchasing investment properties for long term rentals, based on Mashvisor’s latest report.
We selected the cities based on the following criteria:
- Each market has a median property price below $1,000,000
- Each market has no less than 100 active listings
- Each market has at least $2,000 in monthly rental income
- Each market has a cash on cash return of 2.00% or higher
- Each market has a price to rent ratio of 20 and above
The following list includes the 20 best cities to invest in real estate in 2024 and towns that rank high on all of the criteria above, which should give you some ideas about where to invest in real estate in 2024. We ranked them according to the ones with the highest cash on cash returns down to the lowest.
1. Vero Beach, FL
- Median Property Price: $699,474
- Average Price per Square Foot: $340
- Days on Market: 105
- Number of Long Term Rental Listings: 1,015
- Monthly Long Term Rental Income: $2,819
- Long Term Rental Cash on Cash Return: 3.99%
- Long Term Rental Cap Rate: 4.05%
- Price to Rent Ratio: 21
- Walk Score: 78
2. Colorado Springs, CO
- Median Property Price: $701,038
- Average Price per Square Foot: $300
- Days on Market: 68
- Number of Long Term Rental Listings: 107
- Monthly Long Term Rental Income: $2,564
- Long Term Rental Cash on Cash Return: 3.69%
- Long Term Rental Cap Rate: 3.73%
- Price to Rent Ratio: 23
- Walk Score: 29
3. Bethlehem, PA
- Median Property Price: $625,811
- Average Price per Square Foot: $340
- Days on Market: 94
- Number of Long Term Rental Listings: 280
- Monthly Long Term Rental Income: $2,460
- Long Term Rental Cash on Cash Return: 3.60%
- Long Term Rental Cap Rate: 3.66%
- Price to Rent Ratio: 21
- Walk Score: 84
4. Virginia Beach, VA
- Median Property Price: $645,609
- Average Price per Square Foot: $336
- Days on Market: 47
- Number of Long Term Rental Listings: 2,360
- Monthly Long Term Rental Income: $2,537
- Long Term Rental Cash on Cash Return: 3.58%
- Long Term Rental Cap Rate: 3.63%
- Price to Rent Ratio: 21
- Walk Score: 24
5. West Palm Beach, FL
- Median Property Price: $903,734
- Average Price per Square Foot: $475
- Days on Market: 112
- Number of Long Term Rental Listings: 2,718
- Monthly Long Term Rental Income: $3,360
- Long Term Rental Cash on Cash Return: 3.56%
- Long Term Rental Cap Rate: 3.63%
- Price to Rent Ratio: 22
- Walk Score: 44
6. Nashua, NH
- Median Property Price: $857,245
- Average Price per Square Foot: $438
- Days on Market: 46
- Number of Long Term Rental Listings: 140
- Monthly Long Term Rental Income: $3,104
- Long Term Rental Cash on Cash Return: 3.52%
- Long Term Rental Cap Rate: 3.56%
- Price to Rent Ratio: 23
- Walk Score: 95
7. Centerton, AR
- Median Property Price: $612,031
- Average Price per Square Foot: $217
- Days on Market: 103
- Number of Long Term Rental Listings: 413
- Monthly Long Term Rental Income: $2,396
- Long Term Rental Cash on Cash Return: 3.47%
- Long Term Rental Cap Rate: 3.51%
- Price to Rent Ratio: 21
- Walk Score: 54
8. Ewa Beach, HI
- Median Property Price: $849,851
- Average Price per Square Foot: $594
- Days on Market: 53
- Number of Long Term Rental Listings: 212
- Monthly Long Term Rental Income: $3,525
- Long Term Rental Cash on Cash Return: 3.45%
- Long Term Rental Cap Rate: 3.47%
- Price to Rent Ratio: 20
- Walk Score: 62
9. Mililani, HI
- Median Property Price: $753,560
- Average Price per Square Foot: $603
- Days on Market: 60
- Number of Long Term Rental Listings: 149
- Monthly Long Term Rental Income: $3,133
- Long Term Rental Cash on Cash Return: 3.33%
- Long Term Rental Cap Rate: 3.36%
- Price to Rent Ratio: 20
- Walk Score: 52
10. Lewes, DE
- Median Property Price: $696,943
- Average Price per Square Foot: $365
- Days on Market: 174
- Number of Long Term Rental Listings: 157
- Monthly Long Term Rental Income: $2,865
- Long Term Rental Cash on Cash Return: 3.26%
- Long Term Rental Cap Rate: 3.29%
- Price to Rent Ratio: 20
- Walk Score: 66
11. Carmel, IN
- Median Property Price: $719,980
- Average Price per Square Foot: $292
- Days on Market: 67
- Number of Long Term Rental Listings: 167
- Monthly Long Term Rental Income: $2,997
- Long Term Rental Cash on Cash Return: 3.21%
- Long Term Rental Cap Rate: 3.25%
- Price to Rent Ratio: 20
- Walk Score: 64
12. Navarre, FL
- Median Property Price: $610,813
- Average Price per Square Foot: $307
- Days on Market: 97
- Number of Long Term Rental Listings: 253
- Monthly Long Term Rental Income: $2,417
- Long Term Rental Cash on Cash Return: 3.19%
- Long Term Rental Cap Rate: 3.23%
- Price to Rent Ratio: 21
- Walk Score: 6
13. San Bernardino, CA
- Median Property Price: $650,977
- Average Price per Square Foot: $368
- Days on Market: 73
- Number of Long Term Rental Listings: 263
- Monthly Long Term Rental Income: $2,604
- Long Term Rental Cash on Cash Return: 3.17%
- Long Term Rental Cap Rate: 3.20%
- Price to Rent Ratio: 21
- Walk Score: 35
14. St. Petersburg, FL
- Median Property Price: $922,323
- Average Price per Square Foot: $437
- Days on Market: 212
- Number of Long Term Rental Listings: 1,150
- Monthly Long Term Rental Income: $3,301
- Long Term Rental Cash on Cash Return: 3.16%
- Long Term Rental Cap Rate: 3.22%
- Price to Rent Ratio: 23
- Walk Score: 3
15. New Smyrna Beach, FL
- Median Property Price: $728,090
- Average Price per Square Foot: $415
- Days on Market: 95
- Number of Long Term Rental Listings: 155
- Monthly Long Term Rental Income: $2,943
- Long Term Rental Cash on Cash Return: 3.12%
- Long Term Rental Cap Rate: 3.16%
- Price to Rent Ratio: 21
- Walk Score: 26
16. Kerrville, TX
- Median Property Price: $700,995
- Average Price per Square Foot: $278
- Days on Market: 79
- Number of Long Term Rental Listings: 108
- Monthly Long Term Rental Income: $2,605
- Long Term Rental Cash on Cash Return: 3.12%
- Long Term Rental Cap Rate: 3.16%
- Price to Rent Ratio: 22
- Walk Score: 73
17. Winter Park, FL
- Median Property Price: $995,137
- Average Price per Square Foot: $441
- Days on Market: 109
- Number of Long Term Rental Listings: 242
- Monthly Long Term Rental Income: $3,460
- Long Term Rental Cash on Cash Return: 3.11%
- Long Term Rental Cap Rate: 3.15%
- Price to Rent Ratio: 24
- Walk Score: 25
18. Canton, GA
- Median Property Price: $685,345
- Average Price per Square Foot: $236
- Days on Market: 70
- Number of Long Term Rental Listings: 176
- Monthly Long Term Rental Income: $2,837
- Long Term Rental Cash on Cash Return: 3.09%
- Long Term Rental Cap Rate: 3.12%
- Price to Rent Ratio: 20
- Walk Score: 75
19. North Miami, FL
- Median Property Price: $785,965
- Average Price per Square Foot: $478
- Days on Market: 72
- Number of Long Term Rental Listings: 526
- Monthly Long Term Rental Income: $3,220
- Long Term Rental Cash on Cash Return: 3.07%
- Long Term Rental Cap Rate: 3.11%
- Price to Rent Ratio: 20
- Walk Score: 52
20. Durham, NC
- Median Property Price: $584,731
- Average Price per Square Foot: $377
- Days on Market: 159
- Number of Long Term Rental Listings: 885
- Monthly Long Term Rental Income: $2,271
- Long Term Rental Cash on Cash Return: 3.05%
- Long Term Rental Cap Rate: 3.09%
- Price to Rent Ratio: 21
- Walk Score: 39
Aside from offering favorable cash-on-cash returns, many of these cities, such as Bethlehem, PA, and Centerton, AR, feature median property prices below the national average. This allows you to enter the market with less capital and expect a good return.
However, there are other great places for long term rental property investing. If you’re looking to buy rental properties for sale to start a rental property business in the largest city and invest in real estate, a little due diligence can go a long way.
Start looking for the most profitable investment properties in any area of your choice with Mashvisor today.
20 Best Places to Invest in Real Estate for Vacation Rentals in 2024
If you’re in the market looking for vacation rental properties to buy, check out the following locations. The best cities to buy rental property in 2024 included in the list below, like the previous one, were chosen based on the following criteria:
- Each market has a median property price that doesn’t exceed $1,000,000
- Each market has a minimum of 100 active listings
- Each market has a monthly rental income of at least $2,000
- Each market has a cash on cash return of no less than 2.00%
- Each market has a 50% short term rental occupancy rate or higher
And just like the location for long term rentals, the following cities are ranked based on cash on cash return, from the highest to the lowest, using data from Mashvisor’s latest location report.
1. Lincoln Park, MI
- Median Property Price: $202,909
- Average Price per Square Foot: $158
- Days on Market: 107
- Number of Vacation Rental Listings: 102
- Monthly Vacation Rental Income: $2,522
- Vacation Rental Cash on Cash Return: 8.71%
- Vacation Rental Cap Rate: 8.97%
- Vacation Rental Daily Rate: $131
- Vacation Rental Occupancy Rate: 59%
- Walk Score: 78
2. Kirbyville, MO
- Median Property Price: $319,399
- Average Price per Square Foot: $149
- Days on Market: 145
- Number of Vacation Rental Listings: 284
- Monthly Vacation Rental Income: $3,590
- Vacation Rental Cash on Cash Return: 8.43%
- Vacation Rental Cap Rate: 8.58%
- Vacation Rental Daily Rate: $160
- Vacation Rental Occupancy Rate: 53%
- Walk Score: 10
3. Munhall, PA
- Median Property Price: $209,780
- Average Price per Square Foot: $235
- Days on Market: 47
- Number of Vacation Rental Listings: 406
- Monthly Vacation Rental Income: $2,935
- Vacation Rental Cash on Cash Return: 8.42%
- Vacation Rental Cap Rate: 8.64%
- Vacation Rental Daily Rate: $154
- Vacation Rental Occupancy Rate: 53%
- Walk Score: 61
4. Darby, PA
- Median Property Price: $218,550
- Average Price per Square Foot: $151
- Days on Market: 76
- Number of Vacation Rental Listings: 518
- Monthly Vacation Rental Income: $2,854
- Vacation Rental Cash on Cash Return: 8.07%
- Vacation Rental Cap Rate: 8.28%
- Vacation Rental Daily Rate: $143
- Vacation Rental Occupancy Rate: 58%
- Walk Score: 87
5. Rileyville, VA
- Median Property Price: $311,287
- Average Price per Square Foot: $228
- Days on Market: 98
- Number of Vacation Rental Listings: 150
- Monthly Vacation Rental Income: $3,626
- Vacation Rental Cash on Cash Return: 7.97%
- Vacation Rental Cap Rate: 8.11%
- Vacation Rental Daily Rate: $222
- Vacation Rental Occupancy Rate: 58%
- Walk Score: 10
6. Westover, WV
- Median Property Price: $198,880
- Average Price per Square Foot: $154
- Number of Vacation Rental Listings: 112
- Monthly Vacation Rental Income: $2,468
- Vacation Rental Cash on Cash Return: 7.93%
- Vacation Rental Cap Rate: 8.15%
- Vacation Rental Daily Rate: $137
- Vacation Rental Occupancy Rate: 50%
- Walk Score: 26
7. Guyton, GA
- Median Property Price: $439,453
- Average Price per Square Foot: $197
- Days on Market: 50
- Number of Vacation Rental Listings: 354
- Monthly Vacation Rental Income: $5,047
- Vacation Rental Cash on Cash Return: 7.86%
- Vacation Rental Cap Rate: 7.95%
- Vacation Rental Daily Rate: $207
- Vacation Rental Occupancy Rate: 63
- Walk Score: 23
8. Melvindale, MI
- Median Property Price: $147,478
- Average Price per Square Foot: $229
- Days on Market: 56
- Number of Vacation Rental Listings: 142
- Monthly Vacation Rental Income: $2,085
- Vacation Rental Cash on Cash Return: 7.79%
- Vacation Rental Cap Rate: 8.07%
- Vacation Rental Daily Rate: $141
- Vacation Rental Occupancy Rate: 54%
- Walk Score: 64
9. Highland Park, MI
- Median Property Price: $185,486
- Average Price per Square Foot: $108
- Days on Market: 99
- Number of Vacation Rental Listings: 600
- Monthly Vacation Rental Income: $2,246
- Vacation Rental Cash on Cash Return: 7.74%
- Vacation Rental Cap Rate: 8.00%
- Vacation Rental Daily Rate: $149
- Vacation Rental Occupancy Rate: 51%
- Walk Score: 82
10. Oak Park, MI
- Median Property Price: $238,516
- Average Price per Square Foot: $191
- Days on Market: 68
- Number of Vacation Rental Listings: 487
- Monthly Vacation Rental Income: $2,968
- Vacation Rental Cash on Cash Return: 7.67%
- Vacation Rental Cap Rate: 7.84%
- Vacation Rental Daily Rate: $160
- Vacation Rental Occupancy Rate: 58%
- Walk Score: 79
11. Rockbridge, OH
- Median Property Price: $503,610
- Average Price per Square Foot: $272
- Days on Market: 85
- Number of Vacation Rental Listings: 137
- Monthly Vacation Rental Income: $5,568
- Vacation Rental Cash on Cash Return: 7.64%
- Vacation Rental Cap Rate: 7.72%
- Vacation Rental Daily Rate: $308
- Vacation Rental Occupancy Rate: 56%
- Walk Score: 26
12. White Settlement, TX
- Median Property Price: $266,082
- Average Price per Square Foot: $191
- Days on Market: 6
- Number of Vacation Rental Listings: 160
- Monthly Vacation Rental Income: $3,267
- Vacation Rental Cash on Cash Return: 7.54%
- Vacation Rental Cap Rate: 7.69%
- Vacation Rental Daily Rate: $179
- Vacation Rental Occupancy Rate: 61%
- Walk Score: 45
13. Webster, TX
- Median Property Price: $240,910
- Average Price per Square Foot: $161
- Days on Market: 7
- Number of Vacation Rental Listings: 119
- Monthly Vacation Rental Income: $3,261
- Vacation Rental Cash on Cash Return: 7.51%
- Vacation Rental Cap Rate: 7.70%
- Vacation Rental Daily Rate: $189
- Vacation Rental Occupancy Rate: 56%
- Walk Score: 77
14. East Lansdowne, PA
- Median Property Price: $249,079
- Average Price per Square Foot: $181
- Days on Market: 57
- Number of Vacation Rental Listings: 534
- Monthly Vacation Rental Income: $2,675
- Vacation Rental Cash on Cash Return: 7.50%
- Vacation Rental Cap Rate: 7.69%
- Vacation Rental Daily Rate: $143
- Vacation Rental Occupancy Rate: 56%
- Walk Score: 65
15. Elmwood Place, OH
- Median Property Price: $240,525
- Average Price per Square Foot: $127
- Days on Market: 45
- Number of Vacation Rental Listings: 520
- Monthly Vacation Rental Income: $2,909
- Vacation Rental Cash on Cash Return: 7.49%
- Vacation Rental Cap Rate: 7.69%
- Vacation Rental Daily Rate: $140%
- Vacation Rental Occupancy Rate: 55%
- Walk Score: 53
16. Laurel, DE
- Median Property Price: $424,905
- Average Price per Square Foot: $223
- Days on Market: 67
- Number of Vacation Rental Listings: 123
- Monthly Vacation Rental Income: $4,164
- Vacation Rental Cash on Cash Return: 7.45%
- Vacation Rental Cap Rate: 7.56%
- Vacation Rental Daily Rate: $238
- Vacation Rental Occupancy Rate: 55%
- Walk Score: 49
17. Spark, NV
- Median Property Price: $302,911
- Average Price per Square Foot: $210
- Days on Market: 64
- Number of Vacation Rental Listings: 512
- Monthly Vacation Rental Income: $3,365
- Vacation Rental Cash on Cash Return: 7.45%
- Vacation Rental Cap Rate: 7.58%
- Vacation Rental Daily Rate: $165
- Vacation Rental Occupancy Rate: 60%
- Walk Score: 83
18. Ellsworth, ME
- Median Property Price: $403,493
- Average Price per Square Foot: $276
- Days on Market: 144
- Number of Vacation Rental Listings: 168
- Monthly Vacation Rental Income: $4,560
- Vacation Rental Cash on Cash Return: 7.42%
- Vacation Rental Cap Rate: 7.52%
- Vacation Rental Daily Rate: $208
- Vacation Rental Occupancy Rate: 69%
- Walk Score: 66
19. Wisconsin Dells, WI
- Median Property Price: $322,850
- Average Price per Square Foot: $265
- Days on Market: 13
- Number of Vacation Rental Listings: 451
- Monthly Vacation Rental Income: $3,866
- Vacation Rental Cash on Cash Return: 7.37%
- Vacation Rental Cap Rate: 7.50%
- Vacation Rental Daily Rate: $294
- Vacation Rental Occupancy Rate: 50%
- Walk Score: 74
20. Brooklyn, OH
- Median Property Price: $211,967
- Average Price per Square Foot: $139
- Days on Market: 47
- Number of Vacation Rental Listings: 720
- Monthly Vacation Rental Income: $2,635
- Vacation Rental Cash on Cash Return: 7.35%
- Vacation Rental Cap Rate: 7.55%
- Vacation Rental Daily Rate: $137
- Vacation Rental Occupancy Rate: 56%
- Walk Score: 20
Vacation rental properties come with excellent income-generating potential, especially if you’re in a high-tourism market. As an investor looking to buy properties, you should never cross out vacation rentals as an investment strategy. The right property in the right neighborhood could give you a good return on investment and cash flow source.
Go to Mashvisor now to start looking for and analyzing the most profitable short term rental properties in any location of your choice.
How to Find the Best Places to Invest in Real Estate in 2024
Buying an investment property is a great way to generate passive income. It is also a good way to diversify your investments and protect yourself from inflation and rising mortgage rates. However, it can be difficult to find the best market for real estate investors, especially when considering numerous cities.
A few considerations when buying investment properties:
- Location of the property – You’d want to buy an investment property close enough to where you live so that you can visit it often. But you’d also want it to be far enough away that if something happens in that area, it will not affect you too much. Out-of-town investments can also be considered but should be given plenty of thought.
- Price of the property – You’d want to buy a property with great potential for appreciation, especially if you don’t plan to sell it any time soon.
- Cash flow – You’d want your return on investment after expenses (cash on cash return) to be as high as possible, considering the upkeep and other costs associated with rental properties.
Investing With Mashvisor
Investment properties are a great way to make money. But it is not easy to find the best places to buy real estate in 2024. Mashvisor is one of the most popular sites for finding investment properties, and it has already helped thousands of investors in their journeys.
As a website, Mashvisor provides a lot of data to help you find the best places to invest in real estate in 2024. The site gathers data from highly reliable sources, such as Zillow, RedFin, Realtor.com, the MLS, and Airbnb.
Mashvisor also provides detailed information about individual properties and neighborhoods. You can see how much rent each property generates and how much cash on cash return it offers.
In addition, once you subscribe to Mashvisor, you will be given access to handy real estate investing tools like its Property Finder tool, real estate heatmap, and investment property calculator. These tools will help you spot the best properties in the most profitable places to help you achieve your investment goals. Besides, the tools point you to the best opportunity for real estate investors.
Airbnb Rental Calculator
Bedrooms
Bathrooms
 Bedrooms
 Bathrooms
So, before setting out to buy a random property, check out Mashvisor first to ensure you get your money’s worth.
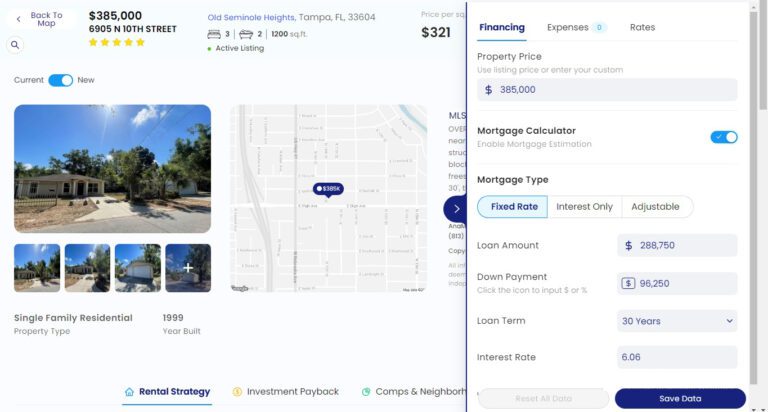
To find the best places to invest in real estate, you need a tool like Mashvisor’s Property Finder. It has a unique calculator designed to help you make accurate and realistic computations.
5 Tips for Real Estate Investing
Other than location, there are many other factors that you need to consider before investing in real estate. This is why real estate investing may be a bit difficult for beginners at first.
But it doesn’t have to be that complicated. That’s why Mashvisor is here.
Here are a few tips to help you have a seamless journey even when you’re new to real estate investing:
Research, Research, and More Research!
Information has always been, and will always be, power. Having the correct information will give you a huge advantage over other investors. Seek to carry out in-depth research on all aspects of real estate investing.
On top of carrying out market research to spot profitable housing markets within your reach, you must also dive deep to spot any hidden investment opportunities. Sometimes, your perception may be different from the realities on the ground.
You can spot some great off-market properties or distressed sellers willing to let go of their properties for a lower price. Your research can lead you to property sellers who want to sell but have not publicly listed the well-maintained properties yet.
Your research will also help you identify which property type has more demand in your market. And speaking of property types…
Choose a Property Type
There are various types of property you have to choose from. The ideal property type depends on a few factors, such as housing demand and population demographics in your market.
For example, it makes more sense to invest in a condo or apartment unit in a college town. If working professionals with families make up the majority of your city’s population, it makes more sense to invest in single-family homes or multi-family units.
The key is to always keep your tenants in mind.
Once you’ve chosen an ideal property type, think of the optimal rental strategy. Different markets are suitable for different rental strategies.
For example, a tourist city with major attractions and many tourists flocking in is ideal for a short term rental strategy. A city with many industries is perfect for long term rentals since the workers need a place to stay.
If your ideal market is a major commercial hub, you can also forego residential real estate in favor of commercial properties. Commercial properties include office buildings, shopping malls, warehouses, assembly plants, and many others.
However, it’s important to note that commercial real estate is a different ball game compared to residential real estate. Again, carry out in-depth research to understand which of the two works best.
Understand the Financial Implications
Quite honestly, real estate investments aren’t cheap. While it can be profitable in the long run, properties require a significant investment upfront. It’s important to determine where you stand financially and whether you can afford to buy in cash or you’ll seek financing.
Investing in properties isn’t as simple as purchasing and watching the investment bring your monthly income. Other additional costs include property taxes, insurance, maintenance, upgrades, and other expenses.
The expenses may become even higher if you choose to invest in a short term rental. It is because you have to furnish the property to appeal to guests, provide utilities such as Wi-Fi, and clean the property every time a guest checks out.
If you’re taking out a loan, remember you’ll have to repay the loan to avoid foreclosure. Seek to understand how much money you’ll have to set aside for mortgage repayment every month.
Be careful not to go for something you can’t afford. Don’t be overambitious. You can always find a real estate investment within your budget.
Build a Team
To most people, investing is a way to secure their future and build wealth for the next generation. It is why it’s important to build a team of various real estate professionals to hold your hand and ensure you get it right.
Firstly you need to get a mentor who’ll show you the ropes and teach you common pitfalls to avoid. Your mentor should be someone who’s successful in the real estate strategy you’re interested in.
After that, get a real estate agent experienced in your local market. This agent should understand your market well so that they can help you comb the market for affordable and profitable deals. They should have vast networks so they can find off-market properties to save you money.
Also, get a real estate attorney who’ll walk you through the legal aspects of real estate transactions. These professionals are also important when writing contracts and protecting yourself from potential scams.
Other important professionals to know include contractors and suppliers, especially if you’re interested in fix-and-flip. These professionals also come in handy when carrying out any upgrades or renovations to your home.
Don’t forget to network with other real estate investors as well.
Think Long Term
One of the most important things you’ll do as a real estate investor is to shift your mindset and start thinking like a business person. Your mindset will significantly impact your success.
For example, an abundance mindset will push you to seek opportunities in every situation and compel you to seek results proactively.
If you’re a beginner investor, know that adapting this mindset and polishing it will take time. It is why you need to think long term.
For example, you need to buy your properties with growth in mind. Every investor wants to offload their properties for a higher price than they purchased them. With this in mind, you’ll make minor upgrades and additions to your property over time to maximize the property’s value.
Also, develop a long term business plan to keep you in check. A business plan helps you focus on the bigger picture and avoid distractions from minor setbacks.
Wrapping It Up
You must keep your eyes peeled for the most profitable investment opportunities, especially in 2024. Knowing the best places to invest in real estate as early as now will give you an edge over the competition.
It also helps if you use the best tools that will help you make accurate ROI projections so you don’t experience buyer’s remorse. Mashvisor will give you access to the best investment tools available out there today. Its tools are guaranteed to help you find the best deals on rental properties that fit your budget and match your needs.
Mashvisor will also give you access to up-to-date, high-quality data to make calculations and projections as accurate and realistic as possible.