A successful real estate investment starts with finding a good market, and one of the main indicators for this is the cap rate by city.
There are many different metrics and measures that investors need to look into when searching for the most profitable opportunities. On top of that, the cap rate has established its position as a must in both residential and commercial real estate. In fact, it has important benefits, such as being easy to calculate and allowing for comparison between markets and properties.
Table of Contents
- Why Is the Cap Rate by City Important?
- 50 Best Cap Rate Cities for Long Term Rentals in 2023
- 50 Best Cap Rate Cities for Short Term Rentals in 2023
- Using Mashvisor Tools to Find the Highest Cap Rates in the US
Real estate is, indeed, one of the best ways to secure your financial future. In fact, it can be the quickest and safest way to build your wealth.
However, investing in real estate is not that straightforward. Of course, there are a number of pitfalls you should be aware of. It can be daunting, especially if you’re not sure how to invest as a first-time investor. The surprises can turn your dreams of independence and wealth into a torment that consequently brings about poor returns, bad debt, and lost opportunities.
For this reason, it’s important to stay informed to avoid potential real estate difficulties and mousetraps and save yourself from the quicksand of debt.
Here, we’ll explain how knowing the cap rate at the city and property levels can help you compare your options and ensure that you’re making the most informed and logical decision. Next, we’ll show you the best cap rates in the US market in 2023 based on Mashvisor’s data.
Why Is the Cap Rate by City Important?
Investing in both long and short term rentals is a solid start for building wealth in real estate. From consistent cash flows to year-round income, real estate properties can yield more frequent and higher returns than traditional means like bonds or stocks and more recent ones such as cryptocurrency.
Ultimately, to make the best-informed decisions, you will need to know what both long and short term rental cap rates by city to expect in 2023.
Why Should You Pay Attention to the Cap Rate?
To understand why the cap rate is so important in real estate investing, we first need to answer the question: What is a cap rate?
To put it simply, the cap rate is the main metric real estate investors use to forecast and measure the ROI of their location and property. In particular, it evaluates the profitability potential of both entire markets and individual properties.
This way, the measure helps investors find areas with the most profitable income properties. In addition, it is easy to use and allows you to compare the investment potential of different locations and listings for sale.
You can calculate it using the cap rate formula below :
Cap Rate = Net Operating Income (NOI)/Property Value x 100%
In other words, it’s the ratio between the net operating income produced by a property and its current value or the original sales price. The net operating income refers to the investment’s total revenue minus the operating expenses.
You should note that the cap rate formula doesn’t include the method of financing, unlike the cash on cash return formula. That’s why the cap rate is faster and more straightforward to calculate than other ROI metrics.
Therefore, it’s important for investors to focus on the highest cap rate cities in the US when deciding where to buy. Moreover, they need to estimate the expected ROI of the property before purchasing it. Ultimately, this is the way to make smart and profitable investment decisions.
How Can Mashvisor Help?
The Mashvisor real estate investing platform can help investors look for the best opportunities in the US residential market in several ways.
Mashvisor can provide data on the cities with the highest cap rates nationwide, both for short and long term rentals. Also, it can help you locate the neighborhoods with the best ROI results too. Finally, Mashvisor can help you identify the highest cap rate properties in any US city, neighborhood, or zip code.
Additionally, our platform offers other crucial information, such as median property prices, average rental income, price to rent ratio, occupancy rate, cash on cash return, and more. The data is available at both market and property levels.
So, let’s dive into our comprehensive data to help you make the best possible real estate investment decision in 2023.
50 Best Cap Rate Cities for Long Term Rentals in 2023
Mashvisor obtains its comprehensive data from several channels, then exports it back to verify its accuracy by comparing it to other sources. Some of the most important sources include the MLS database, Zillow, Redfin, Hotpads, Airbnb, and public records.
In this article, we have organized a portion of Mashvisor’s data into segmented tables to make it easier for you to sift through and analyze it. In particular, this data presents the current state of the US market as of 25 June 2023.
For the selection of the top US cities for long term rental cap rates, we used criteria, such as:
- Median property price below $1,000,000 to ensure affordable locations, even for beginner investors
- 100 or more long term rental listings to provide cities with a strong, well-established rental market
Let’s begin with the US real estate markets with the most impressive cap rates for long term rental properties, arranged from highest to lowest.
Long Term Rental Cap Rates by City in 2023
Below are the 50 US cities with the highest cap rates this year:
| Rank | City | State | Long Term Rental Cap Rate | Monthly Long Term Rental Income | Price to Rent Ratio | Median Property Price | Average Price per Square Foot |
| 1 | Palm Springs | FL | 6.64% | $1,909 | 9 | $210,174 | $210 |
| 2 | Euclid | OH | 6.48% | $1,278 | 9 | $142,634 | $105 |
| 3 | Scranton | PA | 6.46% | $1,847 | 11 | $249,087 | $116 |
| 4 | Detroit | MI | 6.23% | $1,656 | 12 | $240,104 | $158 |
| 5 | Warner Robins | GA | 6.07% | $1,953 | 12 | $283,611 | $139 |
| 6 | Berkeley | NJ | 5.98% | $2,256 | 11 | $291,908 | $220 |
| 7 | Lehigh Acres | FL | 5.81% | $2,440 | 12 | $360,854 | $222 |
| 8 | Cleveland | OH | 5.74% | $1,469 | 12 | $210,107 | $199 |
| 9 | Sumter | SC | 5.71% | $1,765 | 13 | $274,548 | $140 |
| 10 | North Lauderdale | FL | 5.65% | $2,400 | 10 | $301,501 | $229 |
| 11 | Midway Park | NC | 5.61% | $1,472 | 12 | $203,843 | $156 |
| 12 | Warren | MI | 5.58% | $1,610 | 11 | $211,260 | $170 |
| 13 | Odessa | TX | 5.57% | $2,286 | 13 | $358,991 | $153 |
| 14 | South Fulton | GA | 5.44% | $2,049 | 11 | $278,510 | $171 |
| 15 | Margate | FL | 5.40% | $2,368 | 12 | $326,932 | $238 |
| 16 | Riverdale | GA | 5.39% | $1,787 | 12 | $256,007 | $161 |
| 17 | Rochester | NY | 5.37% | $2,011 | 11 | $271,079 | $217 |
| 18 | Port Charlotte | FL | 5.35% | $2,739 | 13 | $443,214 | $265 |
| 19 | Akron | OH | 5.31% | $1,295 | 13 | $197,803 | $120 |
| 20 | Joliet | IL | 5.30% | $2,189 | 11 | $286,529 | $167 |
| 21 | Syracuse | NY | 5.27% | $1,917 | 11 | $263,043 | $245 |
| 22 | Tamarac | FL | 5.27% | $2,284 | 11 | $293,237 | $227 |
| 23 | Glassboro | NJ | 5.22% | $2,410 | 11 | $321,166 | $374 |
| 24 | Shreveport | LA | 5.15% | $1,628 | 15 | $283,312 | $134 |
| 25 | Laredo | TX | 5.14% | $1,848 | 13 | $295,213 | $154 |
| 26 | Johnstown | PA | 5.13% | $1,147 | 13 | $174,722 | $90 |
| 27 | Columbus | GA | 5.13% | $1,446 | 14 | $244,651 | $158 |
| 28 | Lauderhill | FL | 5.12% | $2,025 | 9 | $219,731 | $180 |
| 29 | Martinsburg | WV | 5.07% | $1,939 | 13 | $312,747 | $179 |
| 30 | Ventnor City | NJ | 5.06% | $4,602 | 11 | $600,878 | $334 |
| 31 | Hinesville | GA | 5.05% | $1,753 | 12 | $260,982 | $168 |
| 32 | Tobyhanna | PA | 5.05% | $1,965 | 12 | $278,077 | $191 |
| 33 | Miami Gardens | FL | 5.04% | $2,811 | 12 | $419,705 | $317 |
| 34 | Brownsville | TX | 5.02% | $1,919 | 13 | $292,122 | $153 |
| 35 | California | MD | 5.01% | $2,308 | 13 | $353,103 | $356 |
| 36 | Toms River | NJ | 4.99% | $2,907 | 13 | $455,737 | $288 |
| 37 | East Point | GA | 4.98% | $1,893 | 13 | $300,701 | $199 |
| 38 | Aiken | SC | 4.97% | $2,169 | 16 | $418,628 | $193 |
| 39 | Estero | FL | 4.97% | $4,058 | 14 | $694,119 | $343 |
| 40 | Memphis | TN | 4.97% | $1,886 | 14 | $325,186 | $3,856 |
| 41 | Birmingham | AL | 4.95% | $1,781 | 18 | $374,866 | $174 |
| 42 | Greenville | NC | 4.93% | $2,066 | 13 | $327,129 | $155 |
| 43 | Fort Myers | FL | 4.93% | $3,052 | 15 | $561,758 | $446 |
| 44 | Hammond | LA | 4.92% | $1,592 | 16 | $300,167 | $139 |
| 45 | Midland | TX | 4.92% | $2,720 | 14 | $464,830 | $192 |
| 46 | Willowbrook | IL | 4.91% | $2,500 | 12 | $349,395 | $218 |
| 47 | Mesquite | TX | 4.89% | $2,289 | 13 | $350,704 | $188 |
| 48 | Jonesboro | GA | 4.87% | $1,831 | 13 | $290,513 | $156 |
| 49 | Baton Rouge | LA | 4.86% | $2,222 | 17 | $463,525 | $196 |
| 50 | Vero Beach | FL | 4.86% | $3,249 | 19 | $724,647 | $324 |
Source: Mashvisor, 25 June 2023
Long Term Rentals Capitalization Rate Data: Summary
Mashvisor’s nationwide real estate market analysis certainly shows us the 50 most profitable cities for investing in long term rental properties. In them, the cap rate by city ranges from 4.86% in Vero Beach, FL, to 6.64% in Palm Springs, FL. These are, indeed, very good city-level cap rates allowing properties to generate excellent returns on investment.
According to this data, Palm Springs, FL, has the best cap rate by city in the US in 2023. With its relatively low median property price of $210,174 and rental income of $1,909, in particular, it offers quite lucrative long term rental investment opportunities. Moreover, the average cap rate proves that investing there would bring you some nice profit.
Additionally, another factor that will positively affect your rental business in Palm Springs is its low price to rent ratio. While the market might face less rental demand than markets with high price to rent ratios, this value signals good profitability.
It is driven by property prices being low compared to rental rates, especially since this is how investors make money. But you’d need to be ready to put extra effort into marketing your rental.
So, whether you’re a beginner or an experienced real estate investor, you should consider the cities with the best cap rates for long term rentals in the US.
50 Best Cap Rate Cities for Short Term Rentals in 2023
After the official end of the global pandemic, now is a great time to invest in Airbnb properties. In fact, demand is expected to increase in the coming months as travelers are eager to make up for the opportunities they missed during the Coronavirus threat.
Therefore, investors should keep in mind that people’s travel habits are different from a few years ago as more are willing to travel within the country. For instance, a growing number of travelers are, in fact, choosing to drive to lakeside retreats and mountain towns in search of an excellent and affordable vacation rental.
The demand for properties in mountain towns and rural areas is, indeed, increasing, opening the door for Airbnb hosts in smaller communities and remote destinations to earn more. Of course, investing in larger cities can still be rewarding, provided you can afford the highest property values.
Again, we’ve used Mashvisor Airbnb data from 25 June 2023 to find the 50 cities with the highest cap rates.
To filter this list, we used criteria, such as:
- Median property prices below $1,000,000 for affordability
- 100 or more active vacation rental listings for strong markets
As a result, the 50 best short term rental markets for cap rates in 2023 are:
Short Term Rental Cap Rates by City in 2023
Here are the cities with the best cap rates this year, according to Mashvisor Airbnb market research:
| Rank | City | State | Short Term Rental Cap Rate | Monthly Short Term Rental Income | Short Term Rental Daily Rate | Short Term Rental Occupancy Rate | Median Property Price | Average Price per Square Foot |
| 1 | Rileyville | VA | 8.50% | $4,272 | $219 | 60% | $357,598 | $241 |
| 2 | Newburgh Heights | OH | 8.42% | $2,050 | $140 | 44% | $139,140 | $78 |
| 3 | Overland | MO | 8.38% | $1,762 | $126 | 47% | $124,855 | $119 |
| 4 | Penn Hills | PA | 7.99% | $2,589 | $165 | 50% | $196,250 | $213 |
| 5 | White Settlement | TX | 7.89% | $3,354 | $176 | 59% | $276,068 | $184 |
| 6 | Broadview | IL | 7.80% | $3,118 | $165 | 59% | $236,914 | $181 |
| 7 | Harvey | LA | 7.71% | $3,387 | $214 | 45% | $319,400 | $148 |
| 8 | Roxbury | MA | 7.55% | $2,994 | $245 | 57% | $246,790 | $473 |
| 9 | Oxford | OH | 7.52% | $3,753 | $289 | 37% | $328,072 | $178 |
| 10 | Darby | PA | 7.49% | $2,390 | $140 | 47% | $202,785 | $142 |
| 11 | St. Bernard | OH | 7.46% | $2,315 | $156 | 45% | $241,858 | $120 |
| 12 | Stone Park | IL | 7.24% | $3,538 | $167 | 52% | $308,932 | $171 |
| 13 | Melvindale | MI | 7.21% | $1,855 | $125 | 47% | $139,242 | $242 |
| 14 | Columbia | MO | 7.14% | $2,569 | $157 | 51% | $274,033 | $126 |
| 15 | Lake Worth | TX | 7.11% | $3,291 | $165 | 53% | $297,233 | $197 |
| 16 | Wisconsin Dells | WI | 7.11% | $2,785 | $289 | 37% | $270,991 | $209 |
| 17 | East Lansdowne | PA | 7.09% | $2,244 | $136 | 54% | $249,500 | $149 |
| 18 | New Carrollton | MD | 7.03% | $2,555 | $154 | 61% | $216,175 | $225 |
| 19 | D’Iberville | MS | 7.02% | $3,519 | $169 | 41% | $349,973 | $161 |
| 20 | Greenfield | PA | 7.02% | $2,848 | $152 | 49% | $245,843 | |
| 21 | Wilkinsburg | PA | 6.95% | $2,291 | $144 | 50% | $134,900 | $119 |
| 22 | Blue Mound | TX | 6.87% | $2,950 | $176 | 59% | $268,917 | $230 |
| 23 | Bridgeton | MO | 6.87% | $2,667 | $152 | 63% | $238,450 | $162 |
| 24 | Schiller Park | IL | 6.85% | $3,774 | $178 | 51% | $338,193 | $209 |
| 25 | Geneva | OH | 6.84% | $3,007 | $228 | 43% | $269,528 | $181 |
| 26 | Boyne Falls | MI | 6.81% | $3,171 | $419 | 33% | $285,600 | $168 |
| 27 | Maywood | IL | 6.81% | $3,037 | $168 | 51% | $232,035 | $157 |
| 28 | Bergenfield | NJ | 6.77% | $5,826 | $166 | 66% | $512,660 | $211 |
| 29 | Sansom Park | TX | 6.76% | $2,904 | $164 | 54% | $246,867 | $186 |
| 30 | Logan | OH | 6.75% | $3,854 | $265 | 57% | $431,451 | $441 |
| 31 | Sawyer | MI | 6.70% | $3,474 | $290 | 38% | $334,807 | $297 |
| 32 | Niagara Falls | NY | 6.62% | $1,915 | $185 | 43% | $168,869 | $115 |
| 33 | Pleasantville | NJ | 6.62% | $2,591 | $274 | 39% | $284,537 | $290 |
| 34 | Sheboygan | WI | 6.61% | $2,885 | $240 | 39% | $276,773 | $161 |
| 35 | Sharon Hill | PA | 6.55% | $2,384 | $120 | 54% | $195,829 | $156 |
| 36 | Vinton | VA | 6.53% | $2,680 | $119 | 61% | $276,350 | $150 |
| 37 | South Bend | IN | 6.51% | $2,427 | $267 | 39% | $265,286 | $149 |
| 38 | Lyons | IL | 6.49% | $2,872 | $164 | 49% | $282,856 | $201 |
| 39 | Parma Heights | OH | 6.36% | $2,208 | $139 | 48% | $197,445 | $125 |
| 40 | Middle Smithfield | PA | 6.33% | $2,569 | $258 | 41% | $316,822 | $175 |
| 41 | Crystal | MN | 6.30% | $3,128 | $158 | 58% | $294,883 | $167 |
| 42 | Ocala | FL | 6.27% | $3,579 | $159 | 49% | $366,131 | $193 |
| 43 | Urbana | IL | 6.26% | $3,231 | $161 | 48% | $299,451 | $163 |
| 44 | Jefferson | LA | 6.26% | $3,346 | $180 | 55% | $341,148 | $228 |
| 45 | State College | PA | 6.23% | $4,960 | $534 | 39% | $700,315 | $401 |
| 46 | Nashville | IN | 6.21% | $4,589 | $268 | 54% | $609,923 | $305 |
| 47 | Franklin Park | IL | 6.19% | $3,119 | $168 | 54% | $279,289 | $214 |
| 48 | Holland | MI | 6.19% | $4,437 | $294 | 44% | $524,116 | $247 |
| 49 | Lansing | MI | 6.16% | $2,432 | $119 | 45% | $225,455 | $123 |
| 50 | Fort Wright | KY | 6.15% | $3,173 | $140 | 52% | $321,163 | $156 |
Source: Mashvisor, 25 June 2023
Short Term Rentals Capitalization Rate Data: Summary
According to the data provided by Mashvisor, the 50 top locations for Airbnb investments have cap rates between 6.15% in Fort Wright, KY, and 8.50% in Rileyville, VA. These ROIs exceed the returns offered by long term rental properties in 2023 because of the higher risk associated with investing in a vacation rental.
Vacancy is, in reality, a major challenge for Airbnb hosts, which can negatively impact their revenue and profit. Consequently, investors should put more effort and money into optimizing and marketing their listings. Moreover, cities continue introducing new laws governing the vacation rental industry.
The market with the absolute best cap rate by city for short term rentals is Fort Wright. This city, in particular, is also worth considering because of the affordable median property price of $357,598 and the strong rental income of $4,272. This results from a daily rental rate of $219 and an Airbnb occupancy rate of 60%.
So, investors who want to score a promising Airbnb investment should look into these 50 locations with the highest cap rate by city. While these markets promise a strong return, the risk is not too high.
However, before you decide to buy vacation rentals for sale in any of them, remember to check out the local Airbnb laws. You can start your research at the Mashvisor short term rental regulations page, specifically.
Using Mashvisor Tools to Find the Highest Cap Rates in the US
Location, indeed, affects the capitalization rate of an investment property. Properties are more costly in busy population centers than in rural markets. In other words, the cap rate in San Francisco will be lower than the cap rate in a destination only two hours from the city.
However, location is never limited to the city but includes a particular neighborhood. That’s why savvy inventors need to conduct multilayered analysis before being able to buy a profitable income property.
Ultimately, Mashvisor has three distinct tools that help investors find markets and properties with high cap rate potential across the US.
These tools are:
Market Finder
To start, the Mashvisor Market Finder is a recently developed tool that specifically allows investors to identify areas with optimal cap rates.
Neighborhoods within a city, indeed, come with different cap rates. For this reason, it’s not enough to check a specific cap rate by city. Furthermore, you need to look at the neighborhood level, too. Specifically, thanks to Mashvisor, you won’t need to spend much time sifting through numbers and comparing tons of real estate data. Therefore, you can search for the top neighborhoods with the Market Finder.
All that you need to do is to enter your investment criteria using the available filters like the following:
- Short or long term rental strategy
- Mashmeter Score
- School rankings
- Regulatory environment
- Home values
- Preferred property type (the type of property you rent out also affects the cap rate)
- Monthly rental revenue
- Occupancy rate
- Cap rate
As soon as you choose your requirements, the Market Finder will provide you with a list of the top 10 neighborhoods that meet these criteria. Particularly, you can access quick neighborhood analysis to know what investment results you can expect there.
Above all, this includes the average cap rate for your preferred rental strategy. In case you haven’t decided on a plan yet, you can see the optimal rental strategy in this market. Also, you can investigate what types of properties and what numbers of bedrooms produce the best results.
Certainly, these capabilities make the Mashvisor Market Finder the fastest way to locate areas with strong cap rates and to make informed investment decisions.
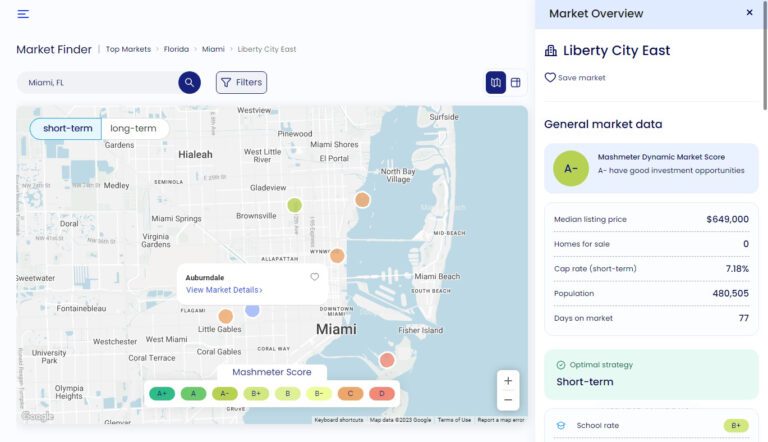
You can easily see the cap rate by city with the market overview feature using Mashvisor’s Market Finder tool.
Investment Property Search Engine
Secondly, investors can also access Mashvisor’s investment property search engine. This tool is available on the Mashvisor home page as well as throughout the website.
Also, investors can use the Mashvisor platform to look for investment properties for sale using different filters. Therefore, doing this lets you customize your search based on your needs and expectations.
The most important criteria include:
- Market (for focus on the highest cap rate by city)
- Cash vs mortgage
- Cash on cash return
- Cap rate
- Budget
- Number of bedrooms
- Number of bathrooms
- Short term and long term rental income
- Year built
- Property type
- Property status
- Neighborhood
In the same way, you can use this search to locate active listings in the neighborhoods you’ve identified with the help of the Market Finder, in your market, or in any other area you’ve come across as potentially profitable. At any rate, with a few clicks of a button, you can find listings available for sale that offer a high cap rate and an affordable price.
Also, it distinguishes Mashvisor from other more conventional methods of locating real estate listings. In contrast, most online and offline property marketplaces target homebuyers. On the other hand, Mashvisor is specifically built with the needs of rental property investors in mind.
In terms of properties, most of the listings available on Mashvisor come directly from the MLS. It means that investors get access to the MLS database without a license. In fact, some off-market properties usually come at discounted prices.
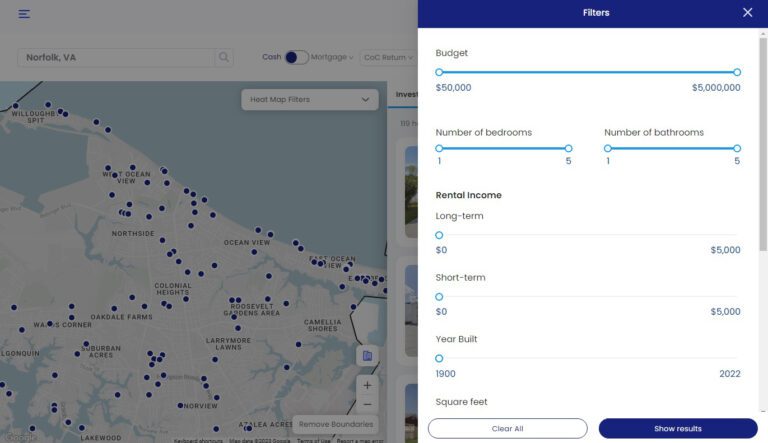
You can use Mashvisor’s investment property search tool to find the most suitable property using different filters.
Cap Rate Calculator
Lastly, the third tool that helps investors locate the most beneficial opportunities across the US residential market is the Mashvisor cap rate calculator. The investment property calculator is, indeed, the next logical step in the process of buying profitable short and long term rentals. Specifically, using our cap rate calculator is the most accurate way to find the cap rate of a specific property.
It is a handy and innovative tool that leverages the power of big data analysis and predictive analytics. It uses nationwide real estate data as well as long and short term data to provide you with a trustworthy estimate of the capitalization rate, especially for any rental property in the US.
What makes the results so accurate and reliable is the fact that they are based on an analysis of the performance of rental comps in the neighborhood. In particular, the calculator looks at how similar properties perform, adjusts for differences between the properties, and produces forecasts for the rental you’re considering. Specifically, it can be a listing available on Mashvisor or any other residential property in the US.
Rental Property Calculator
In addition to helping you calculate the cap rate, Mashvisor also works as a multifaceted rental property calculator.
It provides other metrics essential to real estate investors, such as:
- Listing price
- One-time startup costs
- Comparable rental income
- Recurring monthly expenses
- Cash flow
- Cash on cash return
- Occupancy rate
- Financing information
- Investment payback period
The provided rental property analysis is available for both short and long term rentals. So, investors can decide what rental strategy works best for each property in case they haven’t selected their preference yet.
Moreover, this information decreases risks associated with a real estate investment as investors can find a property that works with both approaches in case they need to switch gears. Regardless of the cap rate by city, individual properties can exceed the averages for either strategy.
Airbnb Rental Calculator
Bedrooms
Bathrooms
 Bedrooms
 Bathrooms
Finding the Best Real Estate Investment Opportunities: Conclusion
In conclusion, in the real estate business, we can never emphasize enough the importance of accurate real estate data. Accessing powerful real estate analytics and predictive data in no more than 15 minutes is of great help. So, there’s no need to ask yourself what cap rate means, how to calculate it, and how to find the cap rate by city.
Indeed, the best place to start your investment search is to know what both short and long term rental cap rates await you in 2023–by city, neighborhood, and property. While obtaining these numbers traditionally requires a lot of time, effort, and money, Mashvisor provides access to all must-have numbers with a few clicks of a button.
First, you can start your analysis from the best cap rate cities in this article and look for the top neighborhoods within them with the Market Finder. Secondly, you can search for top-performing rental properties for sale within these neighborhoods with the help of the investment property search engine. Finally, you can perform a detailed analysis with the cap rate calculator.
To learn more about how Mashvisor can help you search for both long and short term rental investment properties, sign up for a 7-day free trial now, followed by 15% off for life.