Savvy real estate investors know that the first step to finding a great real estate deal is finding a profitable location. The location of your investment property will influence property prices, occupancy rate, rental income, return on investment, and even the type of tenants you get. Therefore, as a real estate investor, you should always aim to find the best areas to invest in real estate. So, what’s the best way to identify the best areas to invest in real estate in 2020?
Well, you first have to understand that it’s going to need a lot of research. While you can collect and analyze property data manually, it can be a very tiresome and time-consuming process. Thankfully, technology has made real estate market research easier than ever. Unlike in the past, you can now find the best places to invest in real estate without much of a hassle. This can be done using a real estate heatmap.
This blog aims to help investors understand how to use Mashvisor’s real estate heatmap to find the best areas to invest in real estate in the US housing market 2020. So, if you are looking to buy an investment property this year, keep reading.
Related: How to Buy a Rental Property Using Mashvisor
Understanding Mashvisor’s Real Estate Heatmap
The real estate heatmap is one of the many real estate investment tools offered by Mashvisor, a revolutionary real estate investment software. This tool uses visual cues to help you easily find profitable neighborhoods in your city of choice. It eliminates the need to sift through tons of numerical data.
To find money-making areas, you simply need to look at different colors. The tool uses a range of colors (green, yellow, orange, and red) to show the performance of different neighborhoods based on a particular metric. Green represents areas with high-performance rates while red represents those with low rates. This way, users can identify the best areas to invest in real estate in a matter of minutes.
Mashvisor’s heatmap is a very user-friendly tool. Therefore, anyone can use it to conduct a neighborhood analysis in their city of choice regardless of their real estate experience. Here’s how to use it:
How to Use Mashvisor’s Real Estate Heatmap to Find the Best Areas to Invest in Real Estate
The first step to using the real estate heatmap is to choose the real estate market you want to invest in. You can check for city data on Mashvisor’s blog to choose the best one for you. After selecting your city of choice and entering it into the search bar on Mashvisor, click on the “Heatmap Data Set” button. You will then be able to focus your heatmap analysis on specific real estate metrics.
After you have selected a particular real estate metric from the menu, you will get a color-coded overlay of the city’s map depicting the performance of different neighborhoods for the selected metric. Here are the key metrics that come with Mashvisor’s heatmap analysis tool:
- Listing Price
- Airbnb Rental Income
- Traditional Rental Income
- Airbnb Cash on Cash Return
- Traditional Cash on Cash Return
- Airbnb Occupancy Rate
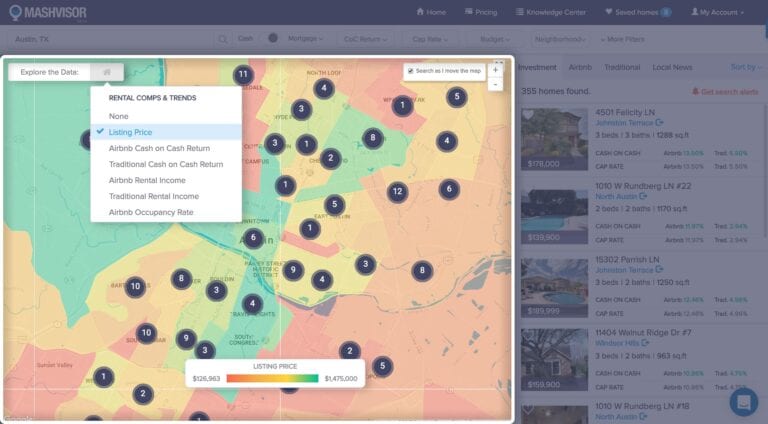
Mashvisor’s Real Estate Heatmap
Let’s look at these metrics in a little more detail so that you understand their importance and how you can analyze them using the heatmap.
Related: Heatmap Analysis: The Secret to Successful Real Estate Investing
1. Listing Price
Where are the best areas to invest in real estate? Well, the answer to this question is relative. Not all markets that are deemed profitable will be suitable for you. The first thing to consider when looking for where to invest in real estate is the median listing price. You want to look for an investment property in an area that you can actually afford. Therefore, if you are thinking of buying a rental property, you should first find an area that fits your budget.
With the heatmap analysis tool, you can find a neighborhood with prices that match your budget. You simply click on the “Listing Price” filter. The heatmap will then project the performance of neighborhoods based on their median listing price.
The highest-priced neighborhoods are marked in green while those with the lowest listing prices for investment properties for sale are marked in red. Therefore, if you are looking for cheap rental properties, the best areas to invest in real estate will be those marked in red or orange.
The heatmap will also show you the minimum and maximum listing prices for the market you have selected. This way, you will have a rough idea of what listing prices the different colors represent. And you can view the median listing price of a neighborhood by hovering over it on the map.
Related: Top 7 Cheapest Cities for Buy-and-Hold Investment Properties
2. Rental Income
Another important metric to consider when finding income properties is rental income. The main aim of buying an investment property is to generate rental income. Rental income is basically how much money your rental property will make. Therefore, you want to buy an income property that will generate enough rental income to cover the rental expenses and generate a profit (positive cash flow).
The real estate heatmap allows you to find the best areas to invest in real estate based on the average rental income generated. By using “Airbnb Rental Income” or “Traditional Rental Income” as your filters, you will be able to see the best areas for high rental income for both rental strategies (marked in green). This way, you will also be able to know the optimal strategy for each neighborhood in terms of rental income.
3. Cash on Cash Return
Most real estate investors will finance a rental property using a mortgage. The key metric they can use to analyze their return on investment is cash on cash return. Therefore, when looking for the best areas to invest in real estate, it’s important to consider the average cash on cash return. Basically, cash on cash return is the cash flow of an investment property expressed as a percentage of the total cash investment.
Mashvisor’s real estate heatmap, alongside its Airbnb calculator, allows you to easily find areas with the highest cash on cash return for both Airbnb and traditional rental strategies. Neighborhoods with high Airbnb cash on cash return and traditional cash on cash return will be marked in green.
Since you’ll be able to analyze cash on cash return for both rental strategies, you can easily identify the rental strategy that will generate higher cash on cash return in a particular neighborhood.
4. Airbnb Occupancy Rate
Lastly, estimating Airbnb occupancy rate is also critical in neighborhood analysis, particularly when looking for where to invest in Airbnb. Airbnb rentals are usually rented out on a nightly basis. Therefore, it’s important to determine how often they are booked relative to the number of nights they are made available for booking in a year.
Savvy real estate investors know that reviewing the Airbnb occupancy rate is key to finding the best area for Airbnb investment. When you click on the “Airbnb Occupancy Rate” filter on the heatmap, Airbnb neighborhoods with the highest Airbnb occupancy rate will be marked in green.
The Bottom Line
As a real estate investor, knowing how to find a profitable investment location is key to your success. While finding where to invest in real estate takes a lot of research, with the right tools, you can make the process quicker and more efficient. It is the best way to locate money-making areas in the real estate market.
If you are looking to invest in real estate in 2020, be sure to use Mashvisor’s real estate heatmap for your neighborhood analysis. With this tool, you will be able to find the best areas to invest in real estate in your market of choice within a few minutes.
To start looking for and analyzing the best neighborhoods for real estate investing in your city of choice, click here.