Nervous about taking the plunge into the Airbnb market? Making a decision based on Airbnb data will allow you to make the leap confidently. And it’s clear that you’ve decided to focus on Airbnb occupancy rate data. So how can a real estate investor find a neighborhood with a high Airbnb occupancy rate?
Before I answer that question, let’s take a step back and ask ourselves “What is a good Airbnb occupancy rate?”
What Is a Good Airbnb Occupancy Rate?
The focus of this post is to teach real estate investors how to find neighborhoods with high Airbnb occupancy rates. But is a high Airbnb occupancy rate a good one?
Generally, your Airbnb occupancy rate should be high enough that you are able to achieve a good return on investment. And now that we’ve introduced return on investment into the formula, it’s clear that when you’re searching for Airbnb for sale, you do need to be looking at a lot more than average occupancy rates.
For example, a neighborhood may have an 80% Airbnb occupancy rate. But if the daily rate for Airbnb rentals is super low, local hosts may only be generating side income as opposed to running a profitable Airbnb business that generates a good return.
On the other hand, a neighborhood could have an Airbnb occupancy rate of only 50%. But if hosts can charge a high enough Airbnb rental rate per night, then it could make for a great place to invest in Airbnb.
Also, note that the average Airbnb occupancy rate for a location is unlikely to be 100%. Short-term rental properties do experience vacancies more than long-term rental properties.
So what is the average occupancy rate for Airbnb? To get a better idea, read: What Airbnb Occupancy Rate Can You Expect in 2020? There, we list the Airbnb occupancy rate by city. With that data, you can get a sense of what to expect this year.
To sum up: It’s difficult to define what a good Airbnb occupancy rate is by just looking at one number. So while your instincts may tell you to go for neighborhoods with a high occupancy rate, it’s best to look at Airbnb investment metrics like cash on cash return and rental income as well. That way, you may be able to find a high Airbnb occupancy rate neighborhood where you can make a lot of money as well.
Let’s take a look at how to find these Airbnb neighborhoods.
How to Find the Best Neighborhoods for Buying Airbnb Property
Now that we’ve cleared a few things up, you’re likely wondering how to find occupancy rates for Airbnb by neighborhood. Trying to calculate Airbnb occupancy rates yourself for neighborhoods or individual investment properties for sale is quite difficult. What you’ll need is access to reliable Airbnb data.
Even with the right numbers, manual Airbnb neighborhood analysis is still time-consuming and prone to error. Why make things difficult for yourself when Airbnb tools exist for this very purpose?
Related: The Airbnb Occupancy Rate Formula – What Is It and How to Use It
The tool I’m referring to is the Airbnb real estate heatmap. The real estate heatmap allows you to conduct a neighborhood analysis based on the following metrics:
- Listing Price
- Traditional Cash on Cash Return
- Airbnb Cash on Cash Return
- Traditional Rental Income
- Airbnb Rental Income
- Airbnb Occupancy Rate
If you took a look at our Airbnb occupancy rate data by city, you may have noticed that the Jersey City real estate market made it in the top 5. But what are the best neighborhoods in Jersey City for the short-term rental strategy? You can find this out in seconds if you search for Jersey City, NJ on Mashvisor’s real estate investment app and apply the heatmap filter for Airbnb occupancy rate:
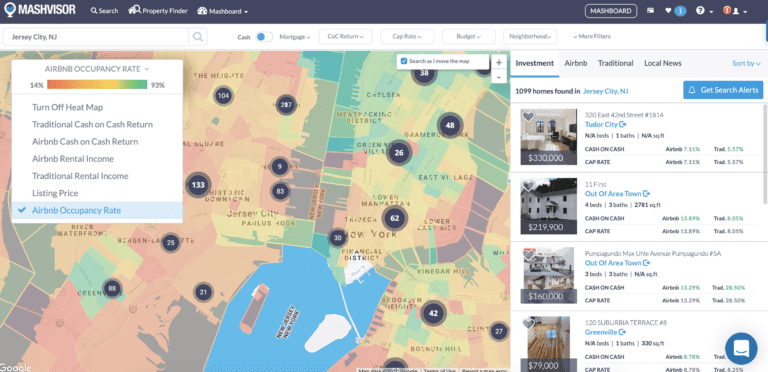
Mashvisor’s Real Estate Heatmap – High Airbnb Occupancy Rate Neighborhoods in Jersey City
The neighborhoods that show up in green are those with the highest Airbnb occupancy rate. At this point, you’ll want to select the filters for cash on cash return and rental income as well, one by one. This will help you find a neighborhood with a good Airbnb occupancy rate, rental income, and return on investment.
Ideally, you want to find a neighborhood that shows up in yellow or green for these metrics. Just keep in mind, that is hard to find. You’ll want to try to find a balanced neighborhood. Meaning, perhaps the neighborhood shows up in orange for Airbnb occupancy rate but green for the other metrics. This could make for a good area for an Airbnb investment.
Related: Airbnb Rentals: Finding Income Properties Using a Heatmap
Note: Mashvisor’s real estate investment software gathers data from real Airbnb rental listings and then calculates the occupancy rate. The final result is verified by real Airbnb hosts to ensure you’re seeing the most accurate data that will allow you to go about buying Airbnb property with confidence.
Follow Up Your Neighborhood Analysis With Airbnb Investment Analysis
Having found a great neighborhood for investing in Airbnb rentals is only the first step. Now it’s time to analyze the Airbnb properties for sale to find the best one. Try using the Airbnb income calculator for this step.
Simply click on an Airbnb investment property for sale that you find on the heatmap. This will give you access to the Airbnb income calculator. Here, you’ll be able to adjust your financing info, resulting in a personalized Airbnb return on investment analysis.
This real estate investment tool not only has an integrated Airbnb occupancy rate calculator, but it also calculates key metrics like the cash on cash return, cash flow, and more. It will also provide Airbnb comps to help you figure out how much to charge for rent down the line.
Essentially, you’ll get access to all the Airbnb analytics you need to make an informed decision. That way, you can be sure that you’re not just focused on one number. Rather, you’ll be able to perform a complete Airbnb investment analysis quickly and easily.
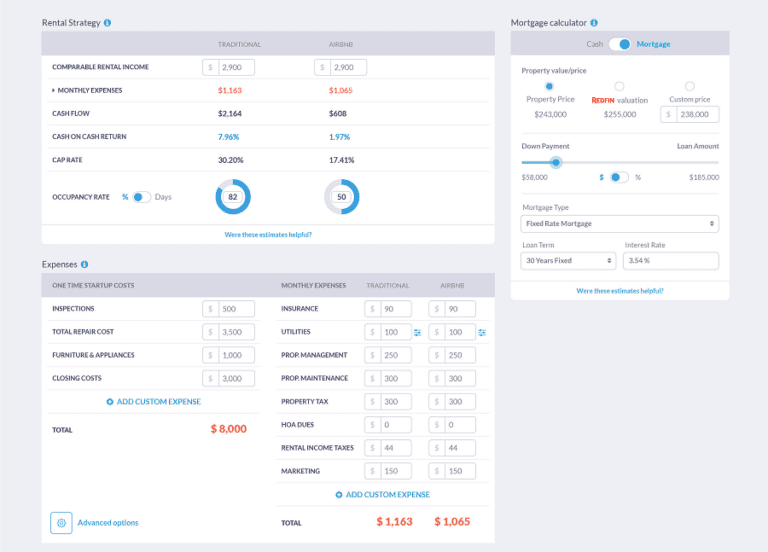
Mashvisor’s Airbnb Income Calculator
Learn More About This Tool: Buying an Airbnb? Use an Airbnb Income Estimator First
Start Investing in Airbnb Today
If you’ve followed along with this guide, you may now be eager to get started with your neighborhood analysis and property search. To get started, sign up for a 7-day free trial with Mashvisor now.