Finding income properties can take a lot of work. This is true whether you are getting your feet wet in real estate or searching for your tenth income property for purchase. Thankfully, real estate investment tools provide an easy path to this difficult process. Of the various investment tools out there, there is only one tool investors need for finding a rental property for sale this year: The real estate heatmap. How does the heatmap help you find the best income properties? Keep reading to find out!
What Is a Real Estate Heatmap?
A real estate heatmap, also known as a heatmap analysis tool, is an investment tool that displays neighborhood data in a visual form. Similar to heatmaps used by weathermen and other professionals, a real estate heatmap presents its data in color-coded form, using the colors red and green, in particular. An investment heatmap uses real estate analytics when computing and presenting its data. By using a heatmap analysis tool, real estate investors learn where to buy an investment property and how to find investment properties.
Where to Find a Real Estate Heatmap
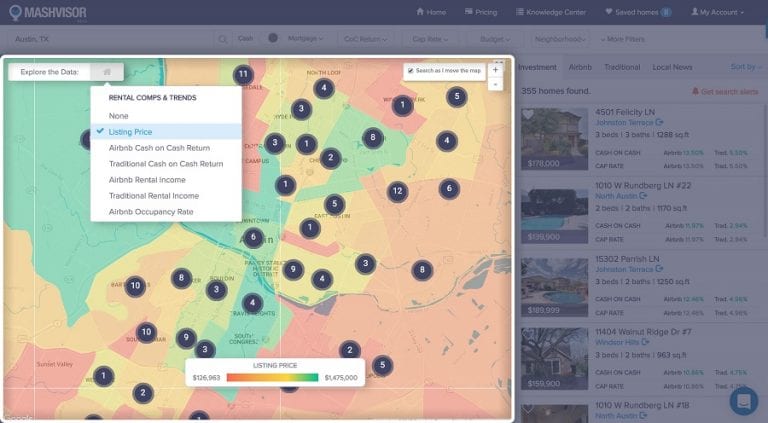
You now know that a heatmap is used to find income properties for sale, but where can you find a heatmap to begin with? Fortunately, you don’t have to look too far! With Mashvisor’s real estate heatmap, you can find the best income properties in the best places to invest in real estate in the US housing market. Interested in learning more about Mashvisor’s heatmap analysis and its many other investment tools? Then CLICK HERE!
How Does a Real Estate Heatmap Find Income Properties?
How exactly does a real estate heatmap find income properties? It does so by searching for the best places to invest in real estate and analyzing a location using various property filters. These filters include:
- Listing price
- Rental income
- Return on investment
- Airbnb occupancy rate
Mashvisor’s Real Estate Heatmap
-
Listing Price
Of all the parameters to consider when finding income properties, the listing price is arguably the most important. This is because a property’s listing price influences its profitability in terms of rental income, return on investment, and real estate appreciation. Mashvisor’s heatmap analysis is perfect for investors interested in investing in cheap rental properties. The heatmap will project neighborhoods based on the prices of rental properties for sale in the selected location. The more expensive neighborhoods are colored green, while the more affordable ones are colored red. This way, real estate investors can find the best income properties that fit their budget using Mashvisor.
-
Rental Income
The essence of all rental property profitability is the property’s rental income. Therefore, real estate investors should pay particular attention to finding income properties that are estimated to generate high rental income. Luckily, Mashvisor’s real estate heatmap allows investors to do just that. Mashvisor’s heatmap uses predictive and traditional real estate analytics when projecting rental income data for a neighborhood, which makes for the most up-to-date values available. Mashvisor provides data for both traditional and Airbnb rental properties for sale, allowing investors to learn about the profitability of both rental strategies in order to choose the best location to buy income property for sale.
-
Return on Investment
While rental income is significant when finding income properties for sale, return on investment is the pure metric that evaluates profitability. This is because ROI takes rental and/or operating expenses into account. The main ROI metric a heatmap analysis calculates is cash on cash return.
Cash on Cash Return
When real estate investors purchase a rental property for sale using a mortgage, they have to use cash on cash return to analyze their return on investment. This is how to calculate cash on cash return:
Cash on Cash Return = (Pre-Tax Cash Flow / Total Cash Investment) x 100%
When using Mashvisor’s heatmap, the cash on cash return is actually equal to the cap rate. Let’s quickly review the cap rate:
Cap Rate
Capitalization rate, or cap rate, is an ROI metric that measures an investment property’s profitability regardless of its financing. Cap rate is calculated as:
Cap Rate = (Net Operating Income / Fair Market Value) x 100%
Net operating income (NOI) is the difference between a property’s rental income and rental expenses. Fair market value (FMV) refers to a property’s listing price or its value.
As you can see, the cash on cash return formula is similar to that of the cap rate. The one difference in the cash on cash return formula is the denominator, which is total cash investment. Mashvisor’s heatmap analysis tool projects the average cash on cash return (and therefore, cap rate) of all the income properties in a neighborhood that an investor selects. And it does so for both Airbnb and traditional properties. You can adjust your monthly mortgage payments to determine estimated cash on cash return using the investment property calculator when you begin analyzing individual properties.
-
Airbnb Occupancy Rate
Finally, when finding Airbnb income properties for purchase, estimating Airbnb occupancy rate is vital for success. The occupancy rate is how often an Airbnb rental is occupied by tenants. Occupancy rate is very important for Airbnb rentals since they are rented out on a nightly basis. The higher it is, the more Airbnb guests will visit the property, and the more profitable the rental becomes. Mashvisor’s real estate heatmap allows investors to find areas with high Airbnb occupancy rates in order to find the most lucrative Airbnb investments in any city.
Further Exploring Neighborhoods with Mashvisor
As part of its neighborhood analysis, Mashvisor provides more in-depth data on neighborhoods. Every neighborhood in the city with income properties for sale is presented. So after conducting your real estate heatmap analysis, each neighborhood can be further selected and analyzed. The neighborhood analysis will display metrics and values for median listing price, rental income, and return on investment (including cap rate and cash on cash return) for both traditional and Airbnb investment properties, and a Mashmeter score, which grades the neighborhood’s investment capability.
All in all, Mashvisor’s real estate heatmap is the only tool you need for finding income properties. To start searching for properties, CLICK HERE to start your FREE 7-day trial with Mashvisor!