Have you ever wondered “What is a good price to rent ratio in real estate investing?” Similar to many other crucially important real estate questions, this one doesn’t have a clear answer.
The answer is: It depends on your key priorities and expectations as a real estate investor. Nevertheless, in this article, we will attempt to figure out a few possible answers to help beginners take their first steps in the exciting world of real estate investing.
What Is Price to Rent Ratio?
Before we tackle “What is a good price to rent ratio for real estate investments?”, we need to have a look at another even more pressing matter: “What is price to rent ratio?”. Being new to property investments, you might have no idea.
In simple terms, the price to rent ratio is defined as the ratio between the average property price and the average rent per year in any housing market. The metric helps determine what’s cheaper (renting vs owning), if it’s a good time to buy, and where the best place to buy might be.
Why Price to Rent Ratio Is Important for Investors
One of the first and most important metrics for real estate investors to calculate before making an investment decision is the price to rent ratio. While the metric is relatively easy to understand and calculate, it’s a crucial factor in determining rental demand, rental income, and return on investment for long term investment properties for sale.
The price to rent ratio helps you analyze the given housing market and assess its profitability before making a purchase – and we all know how important it is to pick the best locations for investing in real estate. Along with other metrics, the price to rent ratio can help you make smart investment decisions when buying a rental property.
Essentially, it answers three important questions:
- Can I afford a rental property investment in this market?
- Is this a good location to invest in?
- Is now a good time to make the purchase?
Calculating the price to rent ratio is key to making sound investment decisions based on numbers and real estate data. So, what is the formula for this real estate metric?
How to Calculate Price to Rent Ratio
You can calculate the price to rent ratio by dividing the average property price by the average annual rent. Here’s the formula:
Price to Rent Ratio = Average Property Price / Average Annual Rent
Or,
Price to Rent Ratio = Average Property Price / Average Monthly Rent x 12
Let’s demonstrate how to calculate the price to rent ratio and take the city of Los Angeles, CA as an example.
According to Mashvisor’s real estate data and predictive analytics, the property price in the Los Angeles real estate market is $812,571 and the average monthly rent is $3,324 (meaning, the annual average rent price = $39,888).
Price to Rent Ratio = $812,571 / $39,888 = 20.37 (or 20)
Following the above formula, the price to rent ratio in Los Angeles, CA is 20. But what exactly does the number say about the real estate market in Los Angeles? Is the said ratio good enough for investors to consider buying an investment property here?
How to Use Price to Rent Ratio
The number you get after doing the price to rent ratio calculation can be used as quantitative data, as well as comparative data to help you analyze the real estate market. How? Basically, the number will fall into one of the following categories:
- High: 21 or above
- Moderate: 16-20
- Low: 15 or below
Traditionally, people use the price to rent ratio when they need to decide whether to rent or buy in a housing market. Each category will tell you something about the real estate market.
A low ratio means that the prices of homes for sale are low compared to the prevailing rental rate, so buying a home makes perfect sense.
Alternatively, when price to rent ratio is too high in a real estate market, residents are better off renting as property prices are just too expensive. In a moderate situation, renters/homebuyers must be more careful, but generally speaking, renting is the better option.
Real estate investors can also make use of the price to rent ratio by city when choosing the best places to invest in real estate. However, unlike with the 1% rule and the 2% rule in real estate or the cap rate and cash on cash return, there is no comprehensive response to the question of what is a good price to rent ratio for investing in rental properties?
Nevertheless, the price to rent ratio metric can give beginner real estate investors some indication of the rental demand and the return on investment they can expect in a particular housing market.
So, let’s look at the best price to rent ratio for positive cash flow rental properties generating high profit.
Good Price to Rent Ratio for Real Estate Investing
However, you might notice something from the categories listed above? The advice above is tailored to help renters and homebuyers make sound financial decisions, not real estate investors.
Investing in Rental Properties in Markets With a High Ratio
Your intuition as a real estate market investor must be telling you that investing in the highest price to rent ratio markets is bad. It looks simple, right? High real estate listings prices combined with relatively low rental income mean bad return on investment or even a negative cash flow investment property.
However, things are rarely black and white in the world of property investments. A ratio of 21 and above can be a positive sign for investors as it is equivalent to strong rental demand for traditional rental properties in this US housing market. High rental demand means good occupancy rate and low vacancy rate, which translates into a good cap rate.
For example, the price to rent ratio by city in the Austin, TX real estate market is 23, based on real estate market analysis done by Mashvisor. This is a rather high value at the city level, so experienced investors might expect not to find profitable rental properties in Austin.
However, this Austin property generates a cap rate of 14.5% when rented out on long term basis, which is simply great. One of the reasons for this is the high traditional occupancy rate of 96% due to the high price to rent ratio in Austin.
Buying an Investment Property in Locations With a Moderate Ratio
Demand for long term rentals in such housing markets is good, while houses for sale prices are not too high compared to rents. What this means for real estate investors is that they can find some of the best rental properties to buy in these locations.
The Chicago real estate market has a moderate price to rent ratio of 18, according to real estate data analysis by Mashvisor. On our platform, investors can find a bunch of top-performing investment properties, including this Chicago rental property, which has an excellent cap rate of 14.4%. This is the result of a relatively low property price ($155,000), low vacancy rate (6%), and good rental income ($1,152).
Investing in Real Estate in Places With a Low Ratio
The instincts of real estate investors tell them to aim for housing markets with a low price to rent ratio by city. With low property prices and high rents – relatively speaking – return on investment must be up. This can definitely be true, but investors need to look at the average occupancy rate before making a final decision. Such locations might suffer from weak rental demand as many people are buying homes rather than renting.
According to Mashvisor’s investment property calculator, the Atlanta real estate market has a price to rent ratio of 12, which is quite low. Nevertheless, this Atlanta property on Mashvisor’s platform enjoys an occupancy rate of 94%, resulting in a high cap rate of 17.4%.
However, keep in mind that the price to rent ratio is a good starting point to a real estate market analysis, but it doesn’t tell you everything. For example, it doesn’t say anything about economic growth, crime rate, whether it’s a seller’s market or buyer’s market, and other factors that make for good places to invest in real estate.
So, real estate investors should always conduct due diligence and do their own research to find such information before selecting their investment location.
Top Cities for Price to Rent Ratio in the US Housing Market
Even though calculating the price to rent ratio by city is absolutely doable for as many US housing markets as you’d wish to do it, it will be rather time-consuming and tedious. That’s why we’ve put together three lists of the major US real estate markets with high, moderate, and low price to rent ratios.
We’ve also included Mashvisor’s real estate data on the average property price, the average traditional rental income, and the average traditional cash on cash return in each of these places. This should help beginner real estate investors focus their attention on the most appropriate location for them based on their budget and expectations:
Table 1: Top Cities with High Price to Rent Ratio in the US Housing Market in 2023
| City | Price to Rent Ratio | Average Property Price | Average Monthly Rent | Average Traditional Cash on Cash Return |
| New York, NY | 34 | $1,101,800 | $2,690 | 0.6% |
| San Francisco, CA | 31 | $1,692,100 | $4,550 | 0.6% |
| Boston, MA | 30 | $930,600 | $2,600 | 0.6% |
| San Diego, CA | 28 | $876,800 | $2,640 | 1.0% |
| Las Vegas, NV | 27 | $444,100 | $1,360 | 1.2% |
| Los Angeles, CA | 26 | $1,068,900 | $3,420 | 1.0% |
| Phoenix, AZ | 26 | $449,300 | $1,470 | 0.9% |
| Jersey City, NJ | 26 | $696,600 | $2,210 | 0.4% |
| Austin, TX | 25 | $619,800 | $2,070 | 0.6% |
| Seattle, WA | 25 | $690,000 | $2,270 | 1.1% |
| Portland, OR | 24 | $588,100 | $2,030 | 0.8% |
| Scottsdale, AZ | 24 | $1,009,000 | $3,470 | 2.1% |
| Colorado Springs, CO | 24 | $451,200 | $1,590 | 1.5% |
| Fort Lauderdale, FL | 23 | $718,000 | $2,650 | 0.6% |
| Washington, DC | 23 | $713,700 | $2,640 | 1.8% |
| Jacksonville, FL | 23 | $653,900 | $2,370 | 1.3% |
| Nashville, TN | 22 | $463,000 | $1,730 | 1.7% |
| Charlotte, NC | 22 | $413,600 | $1,530 | 1.0% |
| Memphis, TN | 22 | $276,100 | $1,060 | 1.0% |
| Miami, FL | 21 | $611,100 | $2,400 | 0.7% |
| Durham, NC | 21 | $352,700 | $1,420 | 1.3% |
| Sacramento, CA | 21 | $427,600 | $1,690 | 1.0% |
| Denver, CO | 21 | $520,300 | $2,020 | 1.8% |
Table 2: Top Cities with Moderate Price to Rent Ratio in the US Housing Market in 2023
| City | Price to Rent Ratio | Average Property Price | Average Monthly Rent | Average Traditional Cash on Cash Return |
| Tampa, FL | 20 | $419,300 | $1,720 | 1.5% |
| Chicago, IL | 19 | $450,100 | $1,970 | 0.7% |
| Dallas, TX | 19 | $416,300 | $1,810 | 0.5% |
| Atlanta, GA | 19 | $446,800 | $1,960 | 1.6% |
| Indianapolis, IN | 19 | $260,400 | $1,140 | 1.7% |
| Minneapolis, MN | 19 | $434,000 | $1,900 | 1.1% |
| Louisville, KY | 19 | $264,900 | $1,140 | 1.3% |
| Pittsburgh, PA | 19 | $295,200 | $1,280 | 1.7% |
| Houston, TX | 18 | $395,200 | $1,830 | 1.5% |
| Orlando, FL | 18 | $347,600 | $1,640 | 1.5% |
| Philadelphia, PA | 18 | $324,200 | $1,470 | 2.1% |
| Palm Springs, CA | 17 | $615,000 | $3,010 | 2.2% |
| Columbus, OH | 17 | $241,700 | $1,190 | 1.3% |
| San Antonio, TX | 16 | $336,100 | $1,740 | 1.8% |
Table 3: Top Cities with Low Price to Rent Ratio in the US Housing Market in 2023
| City | Price to Rent Ratio | Average Property Price | Average Monthly Rent | Average Traditional Cash on Cash Return |
| Kissimmee, FL | 15 | $279,300 | $1,510 | 1.4% |
| Milwaukee, WI | 15 | $199,100 | $1,110 | 1.5% |
| Baltimore, MD | 14 | $263,500 | $1,550 | 2.5% |
| Detroit, MI | 14 | $163,700 | $960 | 1.5% |
| Dayton, OH | 14 | $154,500 | $910 | 1.8% |
| Davenport, IA | 12 | $153,600 | $1,050 | 1.8% |
| Trenton, NJ | 10 | $196,500 | $1,630 | 2.8% |
| Camden, NJ | 7 | $90,900 | $1,140 | 5.7% |
Where to Find Price to Rent Ratio Data
Typically, being able to access accurate and updated real estate data and analytics is not a luxury available to many investors. Such information is usually only available to real estate agents and brokers with access to the MLS or professional real estate investors who devote all their time to collecting and analyzing data.
Beginner real estate investors, however, may find it difficult to get their hands on reliable sources of comprehensive real estate and rental data, such as price to rent ratios by city. The best way to find accurate and up-to-date real estate information is by using an online platform like Mashvisor.
With Mashvisor, you can easily find the best long term and short term rentals for sale. The platform offers several tools to help you locate the best markets for your preferred investment strategy. One such tool is the Market Finder.
Mashvisor’s Market Finder
Market Finder lets you find the top markets based on your investment strategy. For example, if you plan to invest in Florida long term rentals, you just need to select the state from the map. Then, you will see the top markets for long term rentals based on different factors. The factors include the Mashmeter score, rental revenue, cap rate, and crime rate.
You will then see the optimal top markets for your chosen rental strategy. You can click on a specific market to see the important information you need. It includes the average monthly rental revenue and the median property price in the area. Using the said data, you can calculate the price to rent ratio using the formula mentioned earlier.
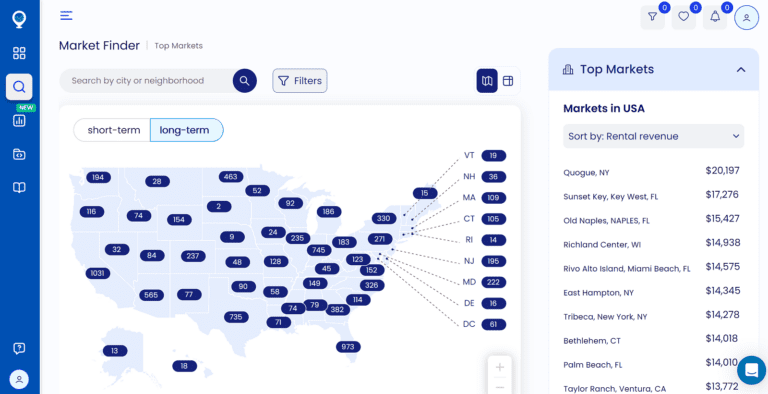
Mashvisor’s Market Finder allows investors to search for and find top markets for long term rentals based on different metrics, such as rental income.
Other Real Estate Metrics for Investors to Know
Here are a few other real estate metrics investors need to know when searching for investment properties:
Net Operating Income (NOI)
In real estate investing, the net operating income (NOI) measures the amount of annual profit a rental property brings in after considering all income collected (or revenue) and covering all of its expenses.
Based on the above definition, the net operating income formula is calculated by simply subtracting your annual operating expenses from your total revenue generated from the rental property: NOI = Gross Income – Operating Expenses
Internal Rate of Return (IRR)
In real estate investing, the internal rate of return refers to an estimate of the value that an investment property will generate during the time frame in which you own it. So, the IRR is, essentially, the percentage of how much you’ll earn on each dollar you invest in a property over the entire holding period. Calculating the formula can be complex, so it may be better to use an online IRR calculator or MS Excel’s IRR function.
Cash Flow
Cash flow refers to the inflow and outflow of cash or cash equivalents in a real estate business. A positive cash flow is the net amount of money an income property generates after paying its expenses and other liabilities. To calculate cash flow in real estate, it’s recommended to use a rental property cash flow calculator to get accurate results.
Cap Rate
The cap rate, or capitalization rate, is a metric used to calculate the return on investment in residential and commercial real estate properties. To calculate the cap rate, simply divide the net operating income (NOI) by that of the property’s value and you’ll get your cap rate.
Cash on Cash Return
Cash on cash return is a metric that determines how much returns you can expect from an income property based on the amount of cash you invested. The CoC return metric is calculated before tax is deducted. Here’s the cash on cash return formula: Cash on Cash Return = (Annual Pre-Tax Cash Flow / Total Cash Invested) x 100
Conclusion
The price to rent ratio is a good metric to use for homebuyers and real estate investors when researching a housing market to determine the choice between buying and renting a real estate property. Generally speaking, real estate markets where the price-to-rent ratio is low are great for buying a rental property, while a higher price-to-rent ratio indicates that home prices are high compared to rental rates.
To make the most out of the price to ratio metric for determining whether to buy or to rent a real estate property, head over to Mashvisor and start analyzing the local US housing markets using the data that we provide.
With Mashvisor, you can access data related to the average home prices and rental rates for each property and for each housing market. You can then use them to calculate the price to rent ratio and determine whether a housing market is a good choice for buying or for renting a property.
To start searching for profitable investment properties for sale in markets with high, moderate, or low price to rent ratio today, sign up for a 7-day free trial of Mashvisor today, followed by 15% off for life.