Deciding where to invest in real estate can be difficult without the proper know-how. There are many things to consider when trying to choose a profitable investment location like property prices, average rental income, and return on investment. You want to find a location where:
- You can afford the property prices
- You can earn a high rental income
- Rental properties generate a good return on investment
How can you find such a location quickly and easily? By taking advantage of the real estate heatmap.
What is a real estate heatmap and where can you find the best one? How will a heatmap show you where to invest in real estate? That’s what this blog is all about!
What Is a Real Estate Heatmap?
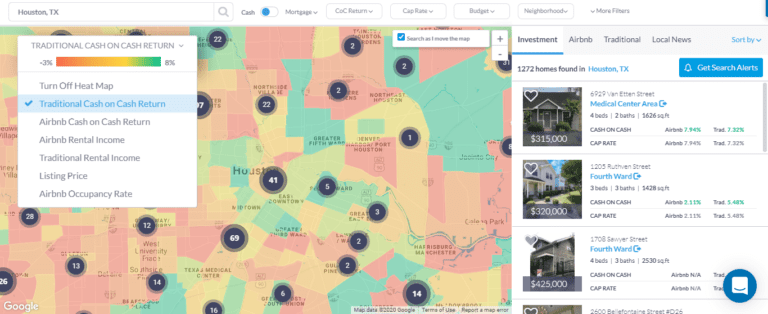
Also known as a heatmap analysis tool, a real estate heatmap is an investment tool that allows investors to quickly analyze the neighborhood data of multiple areas in a real estate market. Like heatmaps used by professionals such as weathermen, a real estate heatmap displays data in a color-coded form. A heatmap analysis tool uses a variety of sources of real estate data and puts it all in one place for you to view. As a result, users can easily find the best places to invest in real estate in any selected market.
Where Can You Find the Best Heatmap Analysis Tool?
While heatmaps are invaluable real estate investment tools, not all heatmaps are created equally. That begs the question, where can you find the best real estate heatmap? Luckily, you don’t have to search too far! Mashvisor’s real estate investment software includes a state-of-the-art heatmap tool. Not only can you analyze traditional neighborhoods with investment properties for sale but the tool functions as an Airbnb heatmap too, allowing short-term rental investors to conduct a neighborhood analysis as well. Mashvisor’s heatmap also relies on predictive analytics, current real estate trends, and real estate comps for each neighborhood analysis. To learn more about Mashvisor’s real estate investment software, CLICK HERE!
How Does the Heatmap Show You Where to Invest in Real Estate?
How can a real estate investor learn where to buy investment property using Mashvisor’s heatmap? The short answer is through using different filters. Mashvisor’s heatmap analysis tool provides 4 main property filters. These include:
- Listing price
- Rental income
- Return on investment
- Airbnb occupancy rate
Mashvisor’s Heatmap Analysis Tool
1. Listing Price
When deciding where to invest in real estate, you need to consider the property prices of the location. As mentioned, the best places to invest in real estate will be ones where you can actually afford to make a purchase. Mashvisor’s heatmap is all you need to find an investment property for sale within your budget. Simply select the filter. The more expensive neighborhoods are colored green. The more affordable neighborhoods, on the other hand, are colored red.
2. Traditional and Airbnb Rental Income
As the basic unit of profit, rental income is another top consideration for where to invest in real estate. Therefore, real estate investors should particularly focus on finding neighborhoods with properties that are estimated to produce high rental income. Mashvisor’s heatmap is the perfect tool for this. The real estate heatmap uses traditional and predictive analytics for neighborhood research, providing the most accurate rental income estimates available. And because Mashvisor’s heatmap utilizes Airbnb analytics, you can also find neighborhoods where short-term rental properties generate a high Airbnb rental income. This will reveal which rental strategy is ideal for a certain neighborhood.
3. Return on Investment (Traditional and Airbnb Cash on Cash Return)
Rental income is obviously important when trying to determine how profitable a location is. However, it does not give the full picture and shouldn’t be the deciding factor for where to invest in real estate. Investors also need to look at the return on investment. Return on investment, or ROI, takes rental expenses into account, leading to a more accurate investment property analysis. Mashvisor’s heatmap focuses on the most important ROI metric: cash on cash return. Here’s a quick overview of the metric:
Cash on Cash Return
A metric you need to analyze when choosing where to invest in real estate is cash on cash return. Cash on cash return measures profit based on the total cash invested into a property. In other words, it estimates profitability based on the financing method. This is how to calculate cash on cash return:
Cash on Cash Return = Pre-Tax Cash Flow ÷ Total Cash Investment
With Mashvisor’s heatmap analysis tool, you can select the filter for cash on cash return. Any neighborhoods where the cash on cash return is expected to be high will show up in green.
4. Airbnb Occupancy Rate
Finally, Mashvisor’s heatmap analysis tool will also point you in the direction of neighborhoods with high Airbnb occupancy rates. This allows Airbnb hosts to know where to invest in real estate to succeed with an Airbnb rental property. Mashvisor’s Airbnb analytics comes from Airbnb directly, ensuring investors get the best data on the market.
How Else Can Mashvisor Help You Choose a Place to Invest in Real Estate?
The real estate heatmap will allow you to quickly narrow down a large number of neighborhoods in a city to a few top choices. It would be smart to continue conducting neighborhood research and Mashvisor knows this. That’s why we provide an in-depth neighborhood analysis for every area in the US housing market. If you click on the name of any neighborhood, you will be taken to the Neighborhood Analytics Page (check out this Neighborhood Analytics Page for a profitable Philadelphia neighborhood.) Accessing this page will provide you with the following additional data on the neighborhood:
- Number of Properties (Investment Properties, Airbnb, and Traditional)
- Optimal Rental Strategy
- Walk Score
- A Rent Analysis (Historical Traditional and Airbnb Rental Income)
- Historical Airbnb Occupancy Rate
- Real Estate Comps
- Optimal Property Type
- Optimal Number of Bedrooms
- Optimal Platform
This means that you will be able to conduct all of your research and choose a place to invest in real estate using one platform – Mashvisor puts everything you need right at your fingertips.
For more on Mashvisor’s heatmap, where to invest in real estate, and how to research real estate markets, CLICK HERE to start your FREE trial with Mashvisor!