Lanikai Investment Analysis
Investment Property in Lanikai, HI

Lanikai, HI Real Estate Investment Performance
N/A
Median
N/A
Avg/Sq.ft.
N/A
Traditional
N/A
Airbnb
N/A
Traditional
N/A
Airbnb
N/A
Traditional
N/A
Airbnb
N/A
Investment
N/A
Airbnb
N/A
Traditional
N/A
Airbnb occupancy rate
Lanikai, HI Properties Rental Prices
| RENTAL STRATEGY | 1 ROOM | 2 ROOMS | 3 ROOMS | 4 ROOMS |
|---|---|---|---|---|
| Airbnb | N/A | N/A | N/A | N/A |
| Traditional | N/A | N/A | N/A | N/A |
| 1 ROOM | N/A |
|---|---|
| 2 ROOMS | N/A |
| 3 ROOMS | N/A |
| 4 ROOMS | N/A |
| 1 ROOM | N/A |
|---|---|
| 2 ROOMS | N/A |
| 3 ROOMS | N/A |
| 4 ROOMS | N/A |
Predict Short-Term Rental Revenue
Want to host your STR property on Airbnb?
Our Airbnb calculator is a free tool to calculate how much can you make on Airbnb.
Top Lanikai, HI Attractions and Activities
-
 Park
Park -
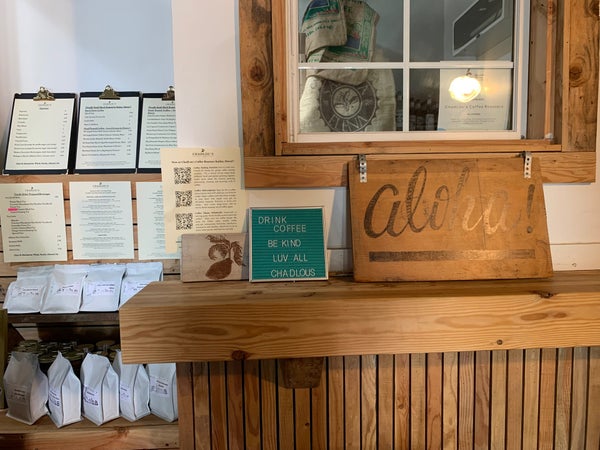 Coffee Shop
 -

Flat Island
7.3
Park -
 Movie Theater
 -
 Playground
 -
 Bar
Bar -

K-Bay Lanes
7.5
Bowling Alley -

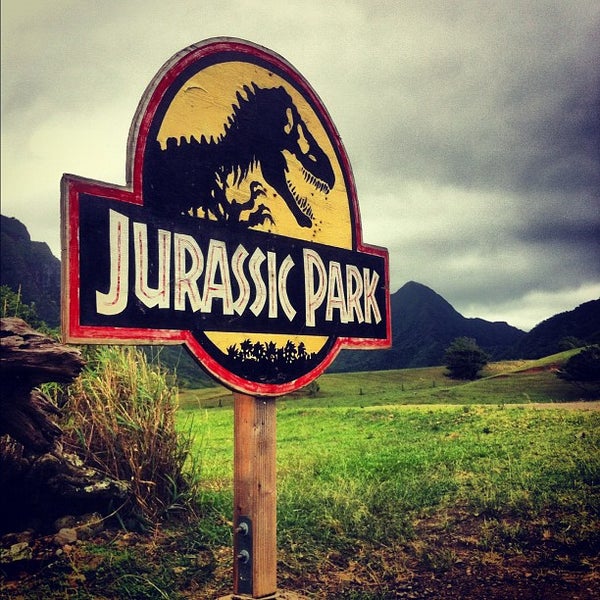
Jurassic World
7.6
Attraction -
 Hiking Trail
 -
 Hiking Trail
 -
 Hiking Trail
 -

Hawaii Loa Ridge
8.2
Hiking Trail -
 Park
Park -
 Volcano
 -
 Hiking Trail
 -
 Scenic Lookout
 -
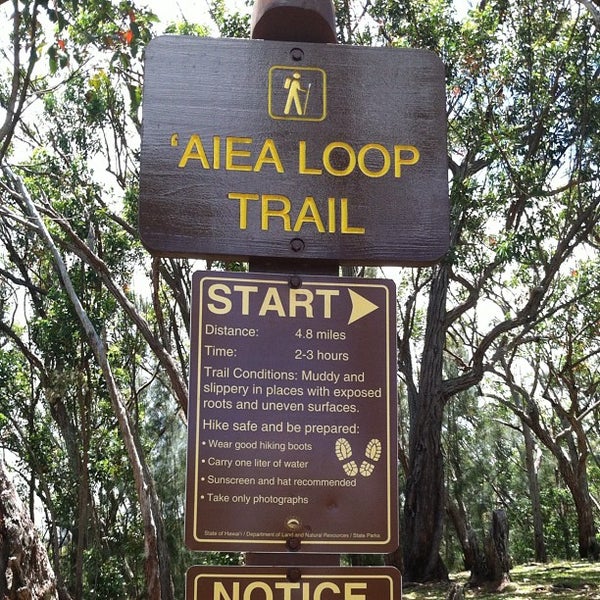
Aiea Loop Trail
7.4
Hiking Trail -

Tantalus Lookout
8.9
Scenic Lookout -
 Scenic Lookout

-

Lanikai Beach
9.5
Beach -
Hiking Trail
-
Park
-
 Beach
Beach -

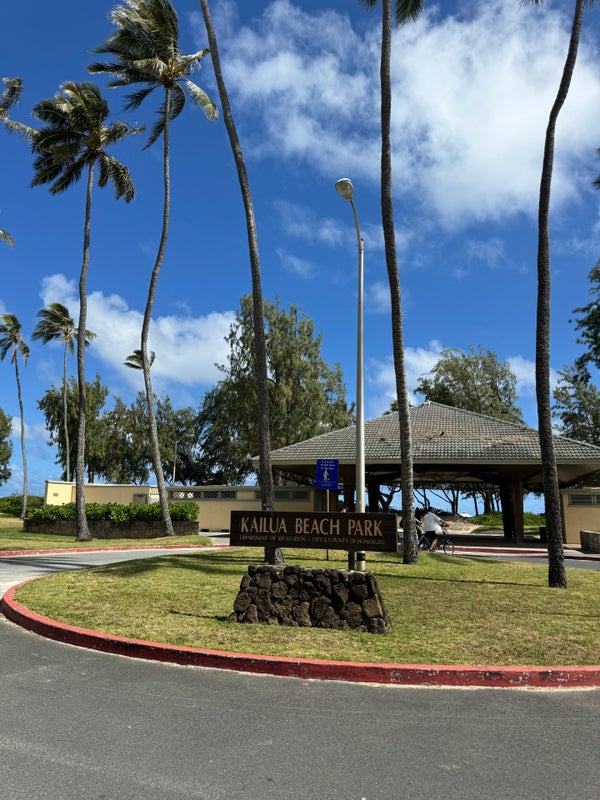
Kailua Beach
8.5
Beach -
 Beach
Beach -
 Beach
Beach -
 Beach
Beach -
Flat Island
7.3
Park -
 Beach
Beach -
 Beach
Beach -
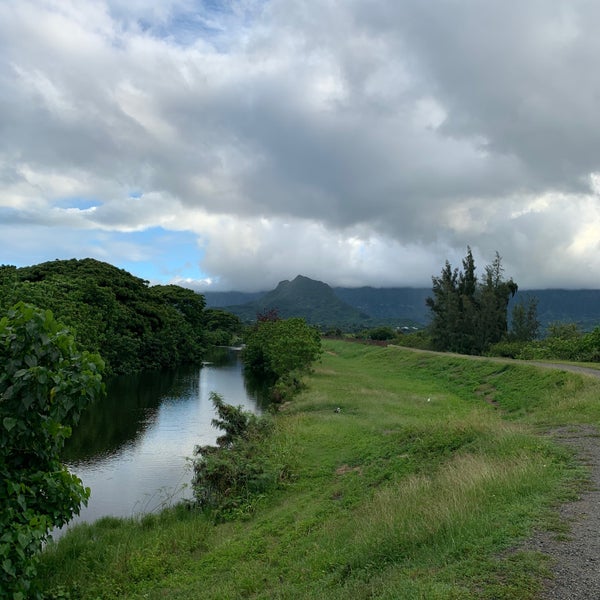
Kawainui Marsh
7.8
Hiking Trail -

North Beach
8.4
Surf Spot -
 Harbor or Marina
 -

Maunawili Falls
8.3
Hiking Trail -
 Beach
Beach -
Scenic Lookout
-
Playground
-
 Beach
Beach -
 Beach
Beach -
 Botanical Garden
 -
 Hiking Trail
 -

Likeke Falls
7.7
Hiking Trail -
 Hiking Trail
 -
 Hiking Trail
 -
Mānoa Falls
8.6
Waterfall -
Hiking Trail
-

Aihualama Trail
7.9
Hiking Trail -
 Botanical Garden
 -

Secret Beach
7.3
Beach -
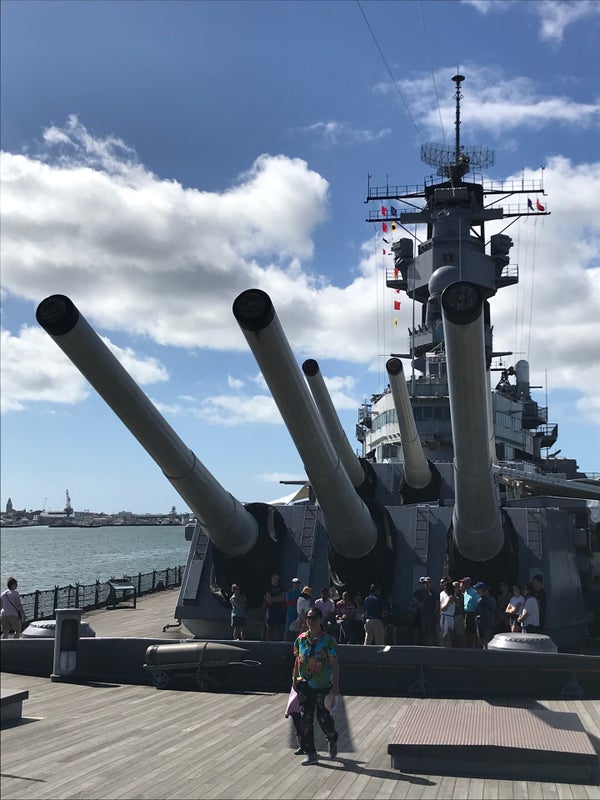
 Historic and Protected Site
 -
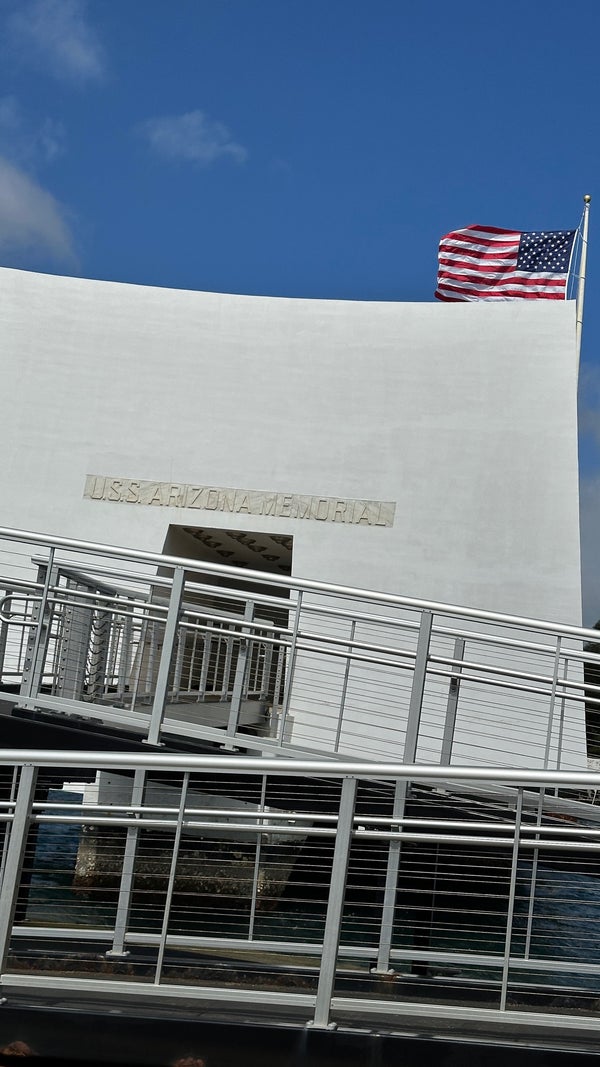
 Memorial Site
 -
 Historic and Protected Site
 -

Battery Cooper
7.6
Historic and Protected Site -
 Historic and Protected Site
 -
 Historic and Protected Site
 -

Aloha Tower
7.2
Historic and Protected Site -
 Historic and Protected Site
 -
Historic and Protected Site
-
Nature Preserve
-
Memorial Site
-
Memorial Site
-
Battery Cooper
7.6
Historic and Protected Site -
Aloha Tower
7.2
Monument -
 Historic and Protected Site
 -
Historic and Protected Site
-
 Historic and Protected Site
 -
 Historic and Protected Site
 -

‘Iolani Palace
8.5
Monument


![%=topPerformingBlogs[i].title%>](https://images.mashvisor.com/40X40/C/https://www.mashvisor.com/blog/wp-content/uploads/2024/03/Vacation-Rental-Marketing-585x390.jpeg)
![%=topPerformingBlogs[i].title%>](https://images.mashvisor.com/40X40/C/https://www.mashvisor.com/blog/wp-content/uploads/2024/03/Airbnb-Amenities-585x390.jpeg)
![%=topPerformingBlogs[i].title%>](https://images.mashvisor.com/40X40/C/https://www.mashvisor.com/blog/wp-content/uploads/2024/03/Choosing-Vacation-Rental-Software-585x390.jpeg)


