Mashvisor has ranked the 100 best cities for Airbnb investment. To be profitable, finding the top places for vacation rentals is crucial. Read to discover the best Airbnb locations.
If you’re planning to buy a short term rental property to make money from real estate this year, you will want to know the best Airbnb markets which offer the highest Airbnb income. Together with the average property prices and the recurring monthly rental expenses, the metric is the most important factor affecting your return on investment.
After the initial decline in the Airbnb industry as a result of the outbreak of the Covid-19 global pandemic in early 2020, short term rentals demonstrated strong resilience, and the Airbnb occupancy rate started recovering within a few months.
What all the above means for real estate investors is that vacation home rentals are once again the more profitable strategy, outperforming long term rentals at large. Thus, buying an investment property for sale in the best areas for Airbnb makes perfect financial sense this year.
Is Airbnb Still Profitable?
Before delving into the best cities for Airbnb investment, let’s quickly go over where the short-term rental industry is currently. After being one of the most adversely affected industries during the pandemic in 2020, the short term rental market quickly got back on its feet.
Airbnb has been on the road to immediate recovery since mid-2021. By now, the number of active listings has crossed 7-million mark globally, with all the best places for Airbnb experiencing growth.
Due to the lucrative opportunities, many investors are still interested in investing in short term rentals.
Why?
It’s because Airbnb in specific, and the short term rental market in general, will remain one of the most profitable real estate investment strategies. Despite the possible cooling off of the real estate market, vacation rentals will remain strong and in demand, especially if you go for the best place to buy an Airbnb.
But the key to success – as always – is choosing one of the most profitable Airbnb locations.
Where Can You Find Reliable Data on Airbnb Income?
Savvy investors know that smart investment decisions are based on solid data that comes from reliable sources. That’s why investors thinking of owning a short term rental property in the best Airbnb locations are looking for the best sources of Airbnb data this year.
If you’re one of these investors, you’ve come to the right place.
Mashvisor is an industry-leading real estate data analytics software that helps both beginner and experienced investors make confident, profitable investment decisions, from locating the best place for Airbnb to finding a top-performing property.
Our real estate data comes from a number of publicly available sources such as the MLS, Airbnb, and public records. We continuously gather this big data before applying our machine-learning algorithms to it in order to provide you with readily available analysis of the performance of entire markets in addition to individual income properties for sale.
If you want to get immediate access to our Airbnb data, you can get started by clicking here.
In this article, we will look at the 100 best Airbnb cities in the US. However, Airbnb rental income data is not enough to ensure a profitable real estate investing decision. Investors also need to know the average Airbnb daily rate, the Airbnb occupancy rate, and the Airbnb cash on cash return to ensure that buying a short term rental property in a certain best location for Airbnb truly makes sense.
Moreover, it’s important to buy affordable properties in order to avoid foreclosure as a beginner real estate investor. That’s why you also need to know the median home value and the average home price per square foot to confirm that a market where you are considering investing is the best area for Airbnb for your particular needs.
Last but not least, investors should know if they are purchasing in a seller’s market or buyer’s market so that they know where to expect a bidding war or not. The average days on market for real estate listings is one of the best indicators of this housing market trend.
We’ve conducted a nationwide real estate market analysis based on our Airbnb data, as well as other relevant property data, to rank the 100 top Airbnb cities with the highest rental income.
Read reading to know where to find the best Airbnb locations for investing this year.
What Are the Best Cities for Airbnb Investment?
Following is our list of the 100 US cities that offer the highest monthly rental income for short term rental properties this year. We’ve organized these markets based on the Airbnb rental income that they provide.
Best Airbnb Locations with Rental Income $2,000-$3,000
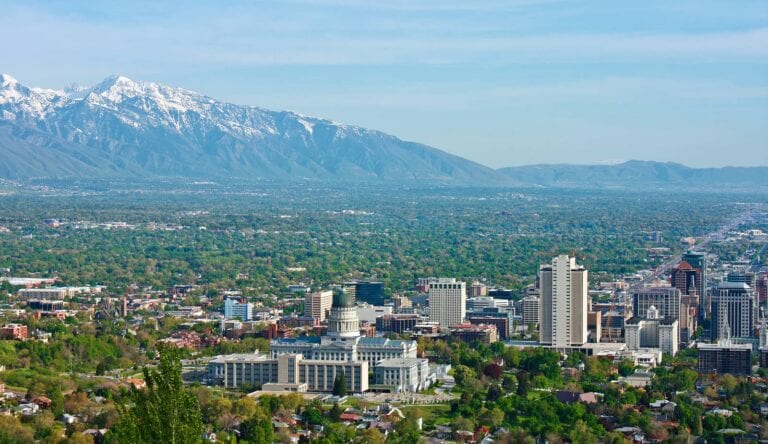
Salt Lake City offers one of the best Airbnb rental incomes
The 22 best places to own an Airbnb to make between $2,000 and $3,000 per month are:
#1. Salt Lake City, UT
- Airbnb Rental Income: $2,800
- Airbnb Daily Rate: $126
- Airbnb Occupancy Rate: 70%
- Airbnb Cash on Cash Return: 2.90%
- Median Property Price: $544,142
- Property Price per Square Foot: $356
- Days on Market: 79
#2. Bourne, MA
- Airbnb Rental Income: $2,804
- Airbnb Daily Rate: $288
- Airbnb Occupancy Rate: 45%
- Airbnb Cash on Cash Return: 3.22%
- Median Property Price: $501,976
- Property Price per Square Foot: $297
- Days on Market: 92
#3. Santa Fe, MN
- Airbnb Rental Income: $2,825
- Airbnb Daily Rate: $199
- Airbnb Occupancy Rate: 65%
- Airbnb Cash on Cash Return: 2.91%
- Median Property Price: $667,813
- Property Price per Square Foot: $326
- Days on Market: 98
#4. Fort Lauderdale, FL
- Airbnb Rental Income: $2,856
- Airbnb Daily Rate: $286
- Airbnb Occupancy Rate: 52%
- Airbnb Cash on Cash Return: 0.44%
- Median Property Price: $753,732
- Property Price per Square Foot: $412
- Days on Market: 131
#5. Norfolk, VA
- Airbnb Rental Income: $2,877
- Airbnb Daily Rate: $151
- Airbnb Occupancy Rate: 62%
- Airbnb Cash on Cash Return: 5.54%
- Median Property Price: $308,014
- Property Price per Square Foot: $909
- Days on Market: 66
Norfolk is one of the best cities to invest in Airbnb as it combines affordability with good income potential, leading to strong ROI.
#6. Avondale, AZ
- Airbnb Rental Income: $2,884
- Airbnb Daily Rate: $179
- Airbnb Occupancy Rate: 71%
- Airbnb Cash on Cash Return: 5.16%
- Median Property Price: $349,128
- Property Price per Square Foot: $176
- Days on Market: 81
#7. Fresno, CA
- Airbnb Rental Income: $2,913
- Airbnb Daily Rate: $124
- Airbnb Occupancy Rate: 73%
- Airbnb Cash on Cash Return: 4.80%
- Median Property Price: $386,383
- Property Price per Square Foot: $206
- Days on Market: 42
Among other factors, the reasonable home values contribute to Fresno being one of the best places for an Airbnb investment property.
#8. Scottsdale, AZ
- Airbnb Rental Income: $2,915
- Airbnb Daily Rate: $281
- Airbnb Occupancy Rate: 62%
- Airbnb Cash on Cash Return: 1.35%
- Median Property Price: $1,049,878
- Property Price per Square Foot: $386
- Days on Market: 91
#9. Naples, FL
- Airbnb Rental Income: $2,926
- Airbnb Daily Rate: $294
- Airbnb Occupancy Rate: 56%
- Airbnb Cash on Cash Return: 1.99%
- Median Property Price: $719,546
- Property Price per Square Foot: $340
- Days on Market: 85
#10. Denver, CO
- Airbnb Rental Income: $2,928
- Airbnb Daily Rate: $150
- Airbnb Occupancy Rate: 67%
- Airbnb Cash on Cash Return: 3.26%
- Median Property Price: $503,959
- Property Price per Square Foot: $358
- Days on Market: 52
#11. Oakland Park, FL
- Airbnb Rental Income: $2,932
- Airbnb Daily Rate: $182
- Airbnb Occupancy Rate: 60%
- Airbnb Cash on Cash Return: 3.98%
- Median Property Price: $354,653
- Property Price per Square Foot: $267
- Days on Market: 76
#12. Olympia, WA
- Airbnb Rental Income: $2,936
- Airbnb Daily Rate: $102
- Airbnb Occupancy Rate: 71%
- Airbnb Cash on Cash Return: 4.51%
- Median Property Price: $426,023
- Property Price per Square Foot: $245
- Days on Market: 33
#13. Sandy Springs, GA
- Airbnb Rental Income: $2,940
- Airbnb Daily Rate: $286211
- Airbnb Occupancy Rate: 48%
- Airbnb Cash on Cash Return: 1.95%
- Median Property Price: $472,684
- Property Price per Square Foot: $218
- Days on Market: 52
#14. Shaker Heights, OH
- Airbnb Rental Income: $2,947
- Airbnb Daily Rate: $124
- Airbnb Occupancy Rate: 60%
- Airbnb Cash on Cash Return: 4.51%
- Median Property Price: $287,481
- Property Price per Square Foot: $138
- Days on Market: 61
#15. Jupiter, FL
- Airbnb Rental Income: $2,953
- Airbnb Daily Rate: $226
- Airbnb Occupancy Rate: 42%
- Airbnb Cash on Cash Return: 0.86%
- Median Property Price: $849,765
- Property Price per Square Foot: $384
- Days on Market: 49
#16. Jackson, MS
- Airbnb Rental Income: $2,954
- Airbnb Daily Rate: $97
- Airbnb Occupancy Rate: 68%
- Airbnb Cash on Cash Return: 6.42%
- Median Property Price: $753,732276,862
- Property Price per Square Foot: $63
- Days on Market: 109
#17. San Angelo, TX
- Airbnb Rental Income: $2,964
- Airbnb Daily Rate: $122
- Airbnb Occupancy Rate: 78%
- Airbnb Cash on Cash Return: 6.14%
- Median Property Price: $405,129
- Property Price per Square Foot: $161
- Days on Market: 271
#18. Edina, MN
- Airbnb Rental Income: $2,971
- Airbnb Daily Rate: $152
- Airbnb Occupancy Rate: 54%
- Airbnb Cash on Cash Return: 1.80%
- Median Property Price: $473,304
- Property Price per Square Foot: $232
- Days on Market: 47
#19. Omaha, NE
- Airbnb Rental Income: $2,976
- Airbnb Daily Rate: $95
- Airbnb Occupancy Rate: 62%
- Airbnb Cash on Cash Return: 4.16%
- Median Property Price: $427,410
- Property Price per Square Foot: $163
- Days on Market: 81
#20. Blacksburg, VA
- Airbnb Rental Income: $2,984
- Airbnb Daily Rate: $442
- Airbnb Occupancy Rate: 35%
- Airbnb Cash on Cash Return: 4.22%
- Median Property Price: $556,805
- Property Price per Square Foot: $203
- Days on Market: 151
#21. Salem, OR
- Airbnb Rental Income: $2,990
- Airbnb Daily Rate: $125
- Airbnb Occupancy Rate: 72%
- Airbnb Cash on Cash Return: 4.43%
- Median Property Price: $424,425
- Property Price per Square Foot: $242
- Days on Market: 53
#22. Arlington, TX
- Airbnb Rental Income: $2,995
- Airbnb Daily Rate: $181
- Airbnb Occupancy Rate: 68%
- Airbnb Cash on Cash Return: 5.42%
- Median Property Price: $315,118
- Property Price per Square Foot: $153
- Days on Market: 87
Best Cities for Airbnb with Rental Income $3,000-$4,000
The 56 best cities to Airbnb to generate between $3,000 and $4,000 in monthly revenue are:
#1. Smyrna, GA
- Airbnb Rental Income: $3,015
- Airbnb Daily Rate: $130
- Airbnb Occupancy Rate: 54%
- Airbnb Cash on Cash Return: 4.48%
- Median Property Price: $397,813
- Property Price per Square Foot: $198
- Days on Market: 54
#2. Tigard, OR
- Airbnb Rental Income: $3,027
- Airbnb Daily Rate: $159
- Airbnb Occupancy Rate: 62%
- Airbnb Cash on Cash Return: 3.06%
- Median Property Price: $558,719
- Property Price per Square Foot: $281
- Days on Market: 28
#3. Colorado Springs, CO
- Airbnb Rental Income: $3,050
- Airbnb Daily Rate: $150
- Airbnb Occupancy Rate: 64%
- Airbnb Cash on Cash Return: 4.71%
- Median Property Price: $477,852
- Property Price per Square Foot: $218
- Days on Market: 36
#4. Dallas, TX
- Airbnb Rental Income: $3,074
- Airbnb Daily Rate: $142
- Airbnb Occupancy Rate: 59%
- Airbnb Cash on Cash Return: 2.83%
- Median Property Price: $485,522
- Property Price per Square Foot: $235
- Days on Market: 58
#5. Oakland, CA
- Airbnb Rental Income: $3,078
- Airbnb Daily Rate: $144
- Airbnb Occupancy Rate: 62%
- Airbnb Cash on Cash Return: 1.21%
- Median Property Price: $865,188
- Property Price per Square Foot: $596
- Days on Market: 59
#6. Eugene, OR
- Airbnb Rental Income: $3,096
- Airbnb Daily Rate: $166
- Airbnb Occupancy Rate: 58%
- Airbnb Cash on Cash Return: 4.01%
- Median Property Price: $471,446
- Property Price per Square Foot: $249
- Days on Market: 34
#7. San Bernardino, CA
- Airbnb Rental Income: $3,109
- Airbnb Daily Rate: $133
- Airbnb Occupancy Rate: 77%
- Airbnb Cash on Cash Return: 5.30%
- Median Property Price: $359,179
- Property Price per Square Foot: $285
- Days on Market: 36
#8. Traverse City, MI
- Airbnb Rental Income: $3,110
- Airbnb Daily Rate: $203
- Airbnb Occupancy Rate: 53%
- Airbnb Cash on Cash Return: 3.63%
- Median Property Price: $604,312
- Property Price per Square Foot: $332
- Days on Market: 86
#9. Sacramento, CA
- Airbnb Rental Income: $3,113
- Airbnb Daily Rate: $126
- Airbnb Occupancy Rate: 75%
- Airbnb Cash on Cash Return: 4.26%
- Median Property Price: $413,857
- Property Price per Square Foot: $301
- Days on Market: 42
#10. Pensacola, FL
- Airbnb Rental Income: $3,125
- Airbnb Daily Rate: $137
- Airbnb Occupancy Rate: 68%
- Airbnb Cash on Cash Return: 3.44%
- Median Property Price: $585,122
- Property Price per Square Foot: $265
- Days on Market: 94
#11. Carrollton, TX
- Airbnb Rental Income: $3,148
- Airbnb Daily Rate: $169
- Airbnb Occupancy Rate: 62%
- Airbnb Cash on Cash Return: 4.60%
- Median Property Price: $373,709
- Property Price per Square Foot: $181
- Days on Market: 81
#12. San Jose, CA
- Airbnb Rental Income: $3,154
- Airbnb Daily Rate: $169
- Airbnb Occupancy Rate: 58%
- Airbnb Cash on Cash Return: 0.67%
- Median Property Price: $993,786
- Property Price per Square Foot: $697
- Days on Market: 45
#13. San Diego, CA
- Airbnb Rental Income: $3,171
- Airbnb Daily Rate: $198
- Airbnb Occupancy Rate: 60%
- Airbnb Cash on Cash Return: 1.53%
- Median Property Price: $899,251
- Property Price per Square Foot: $598
- Days on Market: 52
#14. Raleigh, NC
- Airbnb Rental Income: $3,178
- Airbnb Daily Rate: $138
- Airbnb Occupancy Rate: 66%
- Airbnb Cash on Cash Return: 4.28%
- Median Property Price: $513,064
- Property Price per Square Foot: $232
- Days on Market: 79
#15. Everett, WA
- Airbnb Rental Income: $3,194
- Airbnb Daily Rate: $112
- Airbnb Occupancy Rate: 71%
- Airbnb Cash on Cash Return: 4.10%
- Median Property Price: $441,773
- Property Price per Square Foot: $326
- Days on Market: 59
#16. Tempe, AZ
- Airbnb Rental Income: $3,201
- Airbnb Daily Rate: $193
- Airbnb Occupancy Rate: 62%
- Airbnb Cash on Cash Return: 4.27%
- Median Property Price: $460,060
- Property Price per Square Foot: $270
- Days on Market: 47
#17. Stockton, CA
- Airbnb Rental Income: $3,237
- Airbnb Daily Rate: $94
- Airbnb Occupancy Rate: 62%
- Airbnb Cash on Cash Return: 2.39%
- Median Property Price: $393,043
- Property Price per Square Foot: $251
- Days on Market: 47
#18. Brookhaven, GA
- Airbnb Rental Income: $3,238
- Airbnb Daily Rate: $152
- Airbnb Occupancy Rate: 46%
- Airbnb Cash on Cash Return: 2.48%
- Median Property Price: $540,530
- Property Price per Square Foot: $257
- Days on Market: 67
#19. Tacoma, WA
- Airbnb Rental Income: $3,246
- Airbnb Daily Rate: $127
- Airbnb Occupancy Rate: 68%
- Airbnb Cash on Cash Return: 3.88%
- Median Property Price: $485,092
- Property Price per Square Foot: $281
- Days on Market: 42
#20. Richmond, VA
- Airbnb Rental Income: $3,247
- Airbnb Daily Rate: $143
- Airbnb Occupancy Rate: 66%
- Airbnb Cash on Cash Return: 5.74%
- Median Property Price: $379,923
- Property Price per Square Foot: $203
- Days on Market: 92
#21. Cathedral City, CA
- Airbnb Rental Income: $3,250
- Airbnb Daily Rate: $344
- Airbnb Occupancy Rate: 58%
- Airbnb Cash on Cash Return: 3.21%
- Median Property Price: $504,172
- Property Price per Square Foot: $255
- Days on Market: 62
#22. Portland, ME
- Airbnb Rental Income: $3,271
- Airbnb Daily Rate: $158
- Airbnb Occupancy Rate: 56%
- Airbnb Cash on Cash Return: 2.34%
- Median Property Price: $708,196
- Property Price per Square Foot: $380
- Days on Market: 27
#23. Bethesda, MD
- Airbnb Rental Income: $3,319
- Airbnb Daily Rate: $156
- Airbnb Occupancy Rate: 56%
- Airbnb Cash on Cash Return: 2.43%
- Median Property Price: $859,932
- Property Price per Square Foot: $447
- Days on Market: 81
#24. Prescott, AZ
- Airbnb Rental Income: $3,332
- Airbnb Daily Rate: $130
- Airbnb Occupancy Rate: 66%
- Airbnb Cash on Cash Return: 3.69%
- Median Property Price: $654,946
- Property Price per Square Foot: $283
- Days on Market: 57
#25. Visalia, CA
- Airbnb Rental Income: $3,355
- Airbnb Daily Rate: $104
- Airbnb Occupancy Rate: 84%
- Airbnb Cash on Cash Return: 6.61%
- Median Property Price: $392,630
- Property Price per Square Foot: $193
- Days on Market: 116
#26. Richardson, TX
- Airbnb Rental Income: $3,361
- Airbnb Daily Rate: $203
- Airbnb Occupancy Rate: 65%
- Airbnb Cash on Cash Return: 4.48%
- Median Property Price: $429,139
- Property Price per Square Foot: $192
- Days on Market: 20
#27. Plantation, FL
- Airbnb Rental Income: $3,365
- Airbnb Daily Rate: $235
- Airbnb Occupancy Rate: 59%
- Airbnb Cash on Cash Return: 4.24%
- Median Property Price: $405,098
- Property Price per Square Foot: $213
- Days on Market: 58
#28. Fremont, CA
- Airbnb Rental Income: $3,381
- Airbnb Daily Rate: $159
- Airbnb Occupancy Rate: 65%
- Airbnb Cash on Cash Return: 0.54%
- Median Property Price: $1,111,746
- Property Price per Square Foot: $706
- Days on Market: 24
#29. Bend, OR
- Airbnb Rental Income: $3,384
- Airbnb Daily Rate: $200
- Airbnb Occupancy Rate: 57%
- Airbnb Cash on Cash Return: 2.41%
- Median Property Price: $789,052
- Property Price per Square Foot: $388
- Days on Market: 91
#30. Phoenix, AZ
- Airbnb Rental Income: $3,395
- Airbnb Daily Rate: $190
- Airbnb Occupancy Rate: 65%
- Airbnb Cash on Cash Return: 4.27%
- Median Property Price: $515,757
- Property Price per Square Foot: $258
- Days on Market: 79
#31. Chula Vista, CA
- Airbnb Rental Income: $3,414
- Airbnb Daily Rate: $221
- Airbnb Occupancy Rate: 70%
- Airbnb Cash on Cash Return: 3.23%
- Median Property Price: $625,989
- Property Price per Square Foot: $390
- Days on Market: 41
#32. Round Rock, TX
- Airbnb Rental Income: $3,418
- Airbnb Daily Rate: $282
- Airbnb Occupancy Rate: 67%
- Airbnb Cash on Cash Return: 3.77%
- Median Property Price: $430,366
- Property Price per Square Foot: $191
- Days on Market: 32
#33. Bakersfield, CA
- Airbnb Rental Income: $3,422
- Airbnb Daily Rate: $136
- Airbnb Occupancy Rate: 76%
- Airbnb Cash on Cash Return: 6.31%
- Median Property Price: $375,332
- Property Price per Square Foot: $244
- Days on Market: 54
#34. Gilbert, AZ
- Airbnb Rental Income: $3,422
- Airbnb Daily Rate: $200
- Airbnb Occupancy Rate: 67%
- Airbnb Cash on Cash Return: 4.46%
- Median Property Price: $489,494
- Property Price per Square Foot: $230
- Days on Market: 73
#35. Milwaukee, WI
- Airbnb Rental Income: $3,452
- Airbnb Daily Rate: $128
- Airbnb Occupancy Rate: 59%
- Airbnb Cash on Cash Return: 4.22%
- Median Property Price: $476,223
- Property Price per Square Foot: $269
- Days on Market: 49
#36. Taos, NM
- Airbnb Rental Income: $3,460
- Airbnb Daily Rate: $175
- Airbnb Occupancy Rate: 54%
- Airbnb Cash on Cash Return: 2.56%
- Median Property Price: $910,100
- Property Price per Square Foot: $429
- Days on Market: 284
#37. Chandler, AZ
- Airbnb Rental Income: $3,502
- Airbnb Daily Rate: $178
- Airbnb Occupancy Rate: 64%
- Airbnb Cash on Cash Return: 4.25%
- Median Property Price: $476,518
- Property Price per Square Foot: $241
- Days on Market: 53
#38. Chico, CA
- Airbnb Rental Income: $3,508
- Airbnb Daily Rate: $173
- Airbnb Occupancy Rate: 68%
- Airbnb Cash on Cash Return: 4.57%
- Median Property Price: $541,543
- Property Price per Square Foot: $298
- Days on Market: 47
#39. Frederick, MD
- Airbnb Rental Income: $3,516
- Airbnb Daily Rate: $126
- Airbnb Occupancy Rate: 63%
- Airbnb Cash on Cash Return: 5.03%
- Median Property Price: $410,787
- Property Price per Square Foot: $197
- Days on Market: 76
#40. Fort Collins, CO
- Airbnb Rental Income: $3,569
- Airbnb Daily Rate: $154
- Airbnb Occupancy Rate: 66%
- Airbnb Cash on Cash Return: 3.94%
- Median Property Price: $538,493
- Property Price per Square Foot: $250
- Days on Market: 59
#41. Madison, WI
- Airbnb Rental Income: $3,570
- Airbnb Daily Rate: $208
- Airbnb Occupancy Rate: 64%
- Airbnb Cash on Cash Return: 4.84%
- Median Property Price: $402,398
- Property Price per Square Foot: $210
- Days on Market: 19
#42. Franklin, TN
- Airbnb Rental Income: $3,596
- Airbnb Daily Rate: $192
- Airbnb Occupancy Rate: 57%
- Airbnb Cash on Cash Return: 4.06%
- Median Property Price: $1,102,921
- Property Price per Square Foot: $270
- Days on Market: 18
#43. Boulder, CO
- Airbnb Rental Income: $3,601
- Airbnb Daily Rate: $248
- Airbnb Occupancy Rate: 63%
- Airbnb Cash on Cash Return: 1.90%
- Median Property Price: $1,132,145
- Property Price per Square Foot: $597
- Days on Market: 82
#44. North Hollywood, CA
- Airbnb Rental Income: $3,601
- Airbnb Daily Rate: $127
- Airbnb Occupancy Rate: 63%
- Airbnb Cash on Cash Return: 1.75%
- Median Property Price: $975,923
- Property Price per Square Foot: $560
- Days on Market: 50
#45. Virginia Beach, VA
- Airbnb Rental Income: $3,618
- Airbnb Daily Rate: $252
- Airbnb Occupancy Rate: 55%
- Airbnb Cash on Cash Return: 5.60%
- Median Property Price: $432,470
- Property Price per Square Foot: $229
- Days on Market: 46
#46. Long Beach, CA
- Airbnb Rental Income: $3,628
- Airbnb Daily Rate: $153
- Airbnb Occupancy Rate: 66%
- Airbnb Cash on Cash Return: 2.02%
- Median Property Price: $901,121
- Property Price per Square Foot: $555
- Days on Market: 58
#47. Renton, WA
- Airbnb Rental Income: $3,631
- Airbnb Daily Rate: $190
- Airbnb Occupancy Rate: 51%
- Airbnb Cash on Cash Return: 3.28%
- Median Property Price: $602,074
- Property Price per Square Foot: $318
- Days on Market: 32
#48. Stamford, CT
- Airbnb Rental Income: $3,657
- Airbnb Daily Rate: $174
- Airbnb Occupancy Rate: 65%
- Airbnb Cash on Cash Return: 3.75%
- Median Property Price: $526,053
- Property Price per Square Foot: $299
- Days on Market: 61
#49. San Francisco, CA
- Airbnb Rental Income: $3,800
- Airbnb Daily Rate: $240
- Airbnb Occupancy Rate: 56%
- Airbnb Cash on Cash Return: 0.36%
- Median Property Price: $1,452,510
- Property Price per Square Foot: $1,024
- Days on Market: 98
As one of the most popular Airbnb destinations in the US, it comes as no surprise that San Francisco ranks so high in our list.
#50. Federal Way, WA
- Airbnb Rental Income: $3,813
- Airbnb Daily Rate: $174
- Airbnb Occupancy Rate: 60%
- Airbnb Cash on Cash Return: 5.01%
- Median Property Price: $443,966
- Property Price per Square Foot: $280
- Days on Market: 28
#51. Anaheim, CA
- Airbnb Rental Income: $3,867
- Airbnb Daily Rate: $186
- Airbnb Occupancy Rate: 63%
- Airbnb Cash on Cash Return: 3.00%
- Median Property Price: $748,841
- Property Price per Square Foot: $458
- Days on Market: 39
#52. Austin, TX
- Airbnb Rental Income: $3,906
- Airbnb Daily Rate: $266
- Airbnb Occupancy Rate: 56%
- Airbnb Cash on Cash Return: 2.93%
- Median Property Price: $732,510
- Property Price per Square Foot: $350
- Days on Market: 58
#53. Henderson, NV
- Airbnb Rental Income: $3,909
- Airbnb Daily Rate: $226
- Airbnb Occupancy Rate: 67%
- Airbnb Cash on Cash Return: 4.34%
- Median Property Price: $691,019
- Property Price per Square Foot: $266
- Days on Market: 79
#54. Irvine, CA
- Airbnb Rental Income: $3,916
- Airbnb Daily Rate: $237
- Airbnb Occupancy Rate: 65%
- Airbnb Cash on Cash Return: 1.19%
- Median Property Price: $1,075,121
- Property Price per Square Foot: $538
- Days on Market: 51
#55. Levittown, PA
- Airbnb Rental Income: $3,987
- Airbnb Daily Rate: $104
- Airbnb Occupancy Rate: 78%
- Airbnb Cash on Cash Return: 7.98%
- Median Property Price: $292,897
- Property Price per Square Foot: $218
- Days on Market: 30
Levittown is arguably the best place for Airbnb investment as it offers higher return on investment than any other city.
#56. Charleston, SC
- Airbnb Rental Income: $3,993
- Airbnb Daily Rate: $255
- Airbnb Occupancy Rate: 64%
- Airbnb Cash on Cash Return: 4.12%
- Median Property Price: $707,762
- Property Price per Square Foot: $356
- Days on Market: 96
Top Airbnb Cities with Rental Income $4,000-$5,000
The 16 best places for Airbnb investment for monthly income between $4,000 and $5,000 comprise:
#1. Ithaca, NY
- Airbnb Rental Income: $4,060
- Airbnb Daily Rate: $344
- Airbnb Occupancy Rate: 53%
- Airbnb Cash on Cash Return: 4.24%
- Median Property Price: $574,946
- Property Price per Square Foot: $220
- Days on Market: 63
#2. Claremont, CA
- Airbnb Rental Income: $4,075
- Airbnb Daily Rate: $160
- Airbnb Occupancy Rate: 71%
- Airbnb Cash on Cash Return: 2.89%
- Median Property Price: $776,620
- Property Price per Square Foot: $428
- Days on Market: 30
#3. Eureka, CA
- Airbnb Rental Income: $4,080
- Airbnb Daily Rate: $169
- Airbnb Occupancy Rate: 75%
- Airbnb Cash on Cash Return: 4.91%
- Median Property Price: $545,541
- Property Price per Square Foot: $308
- Days on Market: 83
#4. Chesapeake, VA
- Airbnb Rental Income: $4,086
- Airbnb Daily Rate: $170
- Airbnb Occupancy Rate: 68%
- Airbnb Cash on Cash Return: 6.64%
- Median Property Price: $327,831
- Property Price per Square Foot: $170
- Days on Market: 59
#5. Clarkstown, NY
- Airbnb Rental Income: $4,174
- Airbnb Daily Rate: $225
- Airbnb Occupancy Rate: 66%
- Airbnb Cash on Cash Return: 4.23%
- Median Property Price: $591,990
- Property Price per Square Foot: $282
- Days on Market: 41
#6. Torrance, CA
- Airbnb Rental Income: $4,201
- Airbnb Daily Rate: $204
- Airbnb Occupancy Rate: 76%
- Airbnb Cash on Cash Return: 2.25%
- Median Property Price: $890,430
- Property Price per Square Foot: $578
- Days on Market: 30
#7. San Mateo, CA
- Airbnb Rental Income: $4,246
- Airbnb Daily Rate: $193
- Airbnb Occupancy Rate: 54%
- Airbnb Cash on Cash Return: 0.05%
- Median Property Price: $1,490,840
- Property Price per Square Foot: $952
- Days on Market: 34
Although San Mateo is one of the best places to buy Airbnb rental property for income, beginner investors should be aware of the high property prices.
#8. Mashpee, MA
- Airbnb Rental Income: $4,281
- Airbnb Daily Rate: $365
- Airbnb Occupancy Rate: 49%
- Airbnb Cash on Cash Return: 4.62%
- Median Property Price: $726,406
- Property Price per Square Foot: $374
- Days on Market: 84
#9. Newburgh, NY
- Airbnb Rental Income: $4,340
- Airbnb Daily Rate: $219
- Airbnb Occupancy Rate: 63%
- Airbnb Cash on Cash Return: 6.21%
- Median Property Price: $391,600
- Property Price per Square Foot: $190
- Days on Market: 107
The affordable property prices in Newburgh are one of the reasons to rank it among the best Airbnb locations for investment, especially for beginners with limited budget.
#10. Ventura, GA
- Airbnb Rental Income: $4,354
- Airbnb Daily Rate: $240
- Airbnb Occupancy Rate: 68%
- Airbnb Cash on Cash Return: 2.06%
- Median Property Price: $937,047
- Property Price per Square Foot: $566
- Days on Market: 37
#11. Glendale, CA
- Airbnb Rental Income: $4,358
- Airbnb Daily Rate: $162
- Airbnb Occupancy Rate: 66%
- Airbnb Cash on Cash Return: 1.99%
- Median Property Price: $1,084,650
- Property Price per Square Foot: $639
- Days on Market: 48
#12. Walnut Creek, CA
- Airbnb Rental Income: $4,407
- Airbnb Daily Rate: $177
- Airbnb Occupancy Rate: 71%
- Airbnb Cash on Cash Return: 2.07%
- Median Property Price: $763,097
- Property Price per Square Foot: $560
- Days on Market: 34
#13. San Rafael, CA
- Airbnb Rental Income: $4,457
- Airbnb Daily Rate: $259
- Airbnb Occupancy Rate: 67%
- Airbnb Cash on Cash Return: 2.09%
- Median Property Price: $994,900
- Property Price per Square Foot: $613
- Days on Market: 31
#14. Los Angeles, CA
- Airbnb Rental Income: $4,545
- Airbnb Daily Rate: $193
- Airbnb Occupancy Rate: 64%
- Airbnb Cash on Cash Return: 1.75%
- Median Property Price: $1,155,227
- Property Price per Square Foot: $897
- Days on Market: 73
As Los Angeles is one of the most popular Airbnb locations, occupancy is guaranteed to be high, pushing up Airbnb revenue.
#15. Riverside, CA
- Airbnb Rental Income: $4,800
- Airbnb Daily Rate: $157
- Airbnb Occupancy Rate: 65%
- Airbnb Cash on Cash Return: 5.75%
- Median Property Price: $551,821
- Property Price per Square Foot: $318
- Days on Market: 37
#16. Charlottesville, VA
- Airbnb Rental Income: $4,804
- Airbnb Daily Rate: $273
- Airbnb Occupancy Rate: 60%
- Airbnb Cash on Cash Return: 5.97%
- Median Property Price: $573,284
- Property Price per Square Foot: $240
- Days on Market: 103
Best Locations for Airbnb with Rental Income $5,000 or More
The 6 top Airbnb markets for monthly revenue of $5,000 and more include:
#1. Pasadena, CA
- Airbnb Rental Income: $5,027
- Airbnb Daily Rate: $168
- Airbnb Occupancy Rate: 67%
- Airbnb Cash on Cash Return: 2.02%
- Median Property Price: $1,258,566
- Property Price per Square Foot: $645
- Days on Market: 68
#2. Lake Oswego, OR
- Airbnb Rental Income: $5,069
- Airbnb Daily Rate: $201
- Airbnb Occupancy Rate: 69%
- Airbnb Cash on Cash Return: 2.11%
- Median Property Price: $1,297,181
- Property Price per Square Foot: $423
- Days on Market: 35
#3. Oxnard, CA
- Airbnb Rental Income: $5,198
- Airbnb Daily Rate: $314
- Airbnb Occupancy Rate: 67%
- Airbnb Cash on Cash Return: 3.05%
- Median Property Price: $771,993
- Property Price per Square Foot: $4,343
- Days on Market: 31
#4. Key West, FL
- Airbnb Rental Income: $5,780
- Airbnb Daily Rate: $646
- Airbnb Occupancy Rate: 47%
- Airbnb Cash on Cash Return: 2.28%
- Median Property Price: $1,132,743
- Property Price per Square Foot: $809
- Days on Market: 100
The status of Key West as one of the most popular Airbnb destinations year-round explain why it’s such a great location for this investment strategy.
#5. Santa Barbara, CA
- Airbnb Rental Income: $7,197
- Airbnb Daily Rate: $281
- Airbnb Occupancy Rate: 61%
- Airbnb Cash on Cash Return: 1.77%
- Median Property Price: $1,969,847
- Property Price per Square Foot: $1,033
- Days on Market: 124
With monthly revenue on top of $7,000, it is only logical that Santa Barbara is one of the best markets for Airbnb this year.
#6. San Marino, CA
- Airbnb Rental Income: $7,210
- Airbnb Daily Rate: $154
- Airbnb Occupancy Rate: 77%
- Airbnb Cash on Cash Return: 1.19%
- Median Property Price: $2,773,732
- Property Price per Square Foot: $941
- Days on Market: 109
San Marino is leader among the most profitable Airbnb cities, offering monthly income exceeding $7,000.
How Do You Make a Profitable Real Estate Investment in Best Cities to Own an Airbnb?
Knowing the best places for Airbnb – or the best cities for Airbnb income – is a great starting point for buying a short term rental property that will bring positive cash flow and a high return on investment. However, that’s not enough.
To help you learn how to start an Airbnb business in the right way, we’ve put together the following steps for choosing the best locations for Airbnb that will let you start making money from real estate investing this year:
Step #1. Choose the Best City for Airbnb for Your Investment Needs and Requirements
Each real estate investor has his/her own criteria and expectations. For example, if you’re looking for an affordable real estate market for buying a vacation home to rent out on a short-term basis, you can consider Airbnb Jackson, Airbnb Oakland Park, or Airbnb Bakersfield.
If, on the other hand, you are looking for the best places to have an Airbnb property for the highest rate of return, you should look into Airbnb Levittown, Airbnb Chesapeake, or Airbnb Visalia.
Meanwhile, if you’d like to make your Airbnb income as passive as possible, it’s a good idea to invest in the best Airbnb locations or a location with a high Airbnb occupancy rate in order not to be compelled to put much effort into marketing your rental. Then Airbnb San Angelo, Airbnb Bernardino, or Airbnb San Marino might be the right place for you.
Step #2. Find Out About the Airbnb Laws and Rules
Once you’ve selected a market or two that meet your real estate investment needs and requirements, it’s time to do research on the short-term rental regulations in the area. Many states, counties, and cities have imposed specific laws that govern the short-term rental industry. Before starting an Airbnb investing business, you have to make sure that non-owner-occupied vacation rentals are allowed throughout the year.
Step #3. Select the Best Place to Buy Airbnb Property Within the City
The next step is to conduct neighborhood analysis to determine the best Airbnb locations or the top areas for owning an Airbnb property in the market of your choice. One way to do that is to gather Airbnb rental comps, which refers to Airbnb data on the performance of actual short-term rental listings in the neighborhood.
Another – more efficient – way to do neighborhood real estate market analysis and research is to use Mashvisor’s real estate investment tools. The real estate heatmap will color-code for you neighborhoods based on different criteria, including listing price, Airbnb rental income, Airbnb occupancy rate, and Airbnb cash on cash return. It will help you narrow down your search for the best Airbnb investment locations to areas that fit your budget and that offer a high return on investment on Airbnb income properties for sale.
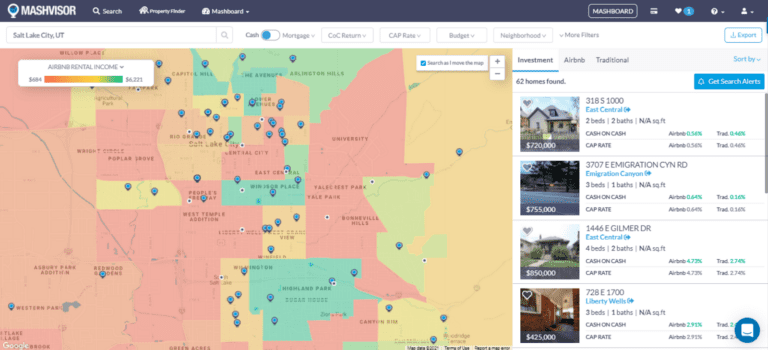
Mashvisor’s heatmap helps you analyze neighborhoods in the best cities for Airbnb rental income
Next, you can use Mashvisor’s neighborhood analysis pages to get all the real estate data on the performance of Airbnb rentals in the areas you’ve selected. You can see the median property price, the average Airbnb rental income, Airbnb occupancy rate, and Airbnb cash on cash return, as well as real estate comps and the optimal property type and the number of bedrooms in this neighborhood.
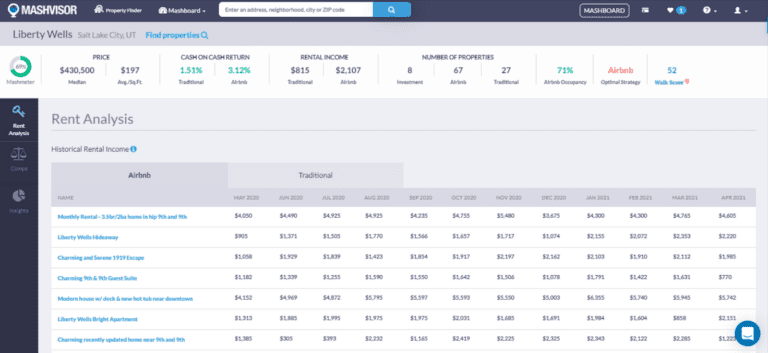
Mashvisor’s neighborhood analysis pages help investigate the potential of areas in the top markets for Airbnb income.
If you want to give our tools a try, you can start by clicking here.
Step #4. Search for Investment Properties for Sale
Once you know where you’d like to invest in Airbnb this year, you should start your investment property search. You can use Mashvisor’s property search engine or rental property finder to do that.
All you need to do is to set up your preferred market and neighborhood, budget, expected rental income and cash on cash return, number of bedrooms, property type (single-family home, townhouse, condo, or apartment), and listing type (MLS listings for sale or off market properties).
As soon as you’ve done that, the Mashvisor real estate investment software will provide you with a list of all rental properties for sale which match your criteria.
Step #5. Analyze the Investment Potential of Real Estate Listings
While all properties provided by Mashvisor’s real estate online marketplace will match your requirements, they are not all equal. You should conduct a detailed investment property analysis to find the most suitable and lucrative deal for your specific situation in the most profitable cities for Airbnb.
You are in luck once again. Mashvisor’s Airbnb profit calculator provides you with a comprehensive investment property analysis that gives you all the Airbnb analytics and data that you need to make the best real estate investing decision.
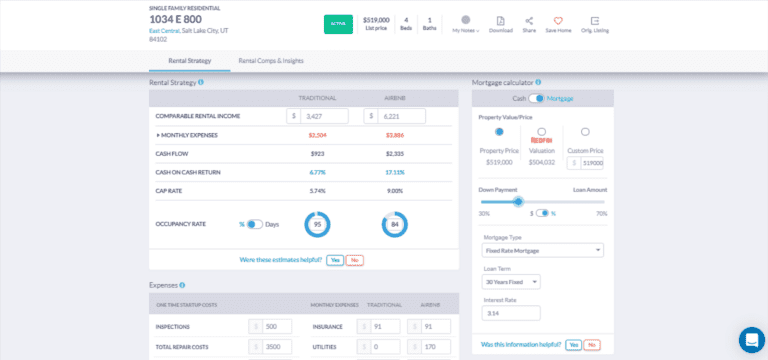
Mashvisor’s investment property calculator helps you analyze properties in the best cities for Airbnb.
Step #6. Buy the Property
Once you know which income property for sale you’d like to invest in, it’s time to move forward with the process of buying rental property. If it’s the first time that you engage in a real estate transaction, it’s a smart move to hire one of the top-performing real estate agents in your market, especially if you’re investing in one of the hottest Airbnb markets with quick transactions and bidding wars.
It is also true if you’re buying an investment property in a seller’s market where competition among buyers is tough. A skilled and experienced agent will be able to help you close the deal in the most profitable way while making sure all legalities are fulfilled.
Conclusion: Investing in the Best Cities for Airbnb
Investing in Airbnb can be a very smart and profitable investment move as long as it’s based on reliable data and solid research. Now that you know the 100 best Airbnb locations in the US for rental income this year, the first step is done. The next step is to get access to reliable real estate investment tools – like Mashvisor – to start searching for and analyzing Airbnb properties in these top markets.
FAQs: Investing in the Best Cities for Airbnb
What Makes for a Good Location for Airbnb Investment?
Knowing how to find a good Airbnb property starts with learning how to find a good market for this investment strategy.
Here are the eight major factors to take into consideration if you want to know how to tell if an area is good for Airbnb:
1. Close Proximity to Popular Attractions
When looking for the best location to buy an Airbnb investment property, you should search for cities that enjoy a large number of visitors. Short term visitors may include tourists or business travelers, or both, depending on your preferred Airbnb guest group.
Cities with sought-after attractions like national parks, mountains, lakes, beaches, resorts, museums, theaters, and theme parks are typically desirable to tourists. Meanwhile, destinations with strong economies, multiple businesses, company headquarters, and transportation hubs attract business people.
Such areas usually have a high Airbnb occupancy rate, making them the best places for Airbnb investment. The occupancy rate is one of the most significant determinants of Airbnb’s return on investment, together with the average daily rate. The fewer vacancies you have, the higher your Airbnb monthly rental income will be. This, in turn, will push up your cash on cash return and cap rate.
2. Low Competition
Competition will also influence your Airbnb occupancy rate and ROI. To ensure a high short term rental occupancy rate, you should choose a location with a low supply of hotels and other vacation rental listings.
Places with fierce competition among Airbnb hosts, like big cities and major resorts, should be avoided. If there are many hotels or rentals in the area, you’ll be forced to keep your rates low.
Medium-sized towns with fewer hotels and short term rental options would be your best bet as a beginner investor. In areas with a relatively low supply of hotels and vacation rentals, Airbnb prices tend to go up, provided that there is demand from guests. So, you need to strike the right balance between supply and demand in your Airbnb market research and analysis.
3. Weak Effect of Seasonality
When thinking of how to tell if an area is good for Airbnb, seasonality is a factor you should take into account. You don’t want to purchase an Airbnb investment property in a place with long off-seasons. These usually include seasonal destinations like beach towns and ski resorts, as well as cities that attract interest mostly during major conferences, festivals, and other events.
If your property stays empty for long periods without generating rental income, it will end up costing you more money in the long run. Savvy Airbnb hosts invest in areas with a high influx of travelers all year round. In such places, the demand for short term rentals is consistent. It boosts both Airbnb’s revenue and profitability.
4. Lenient Airbnb Laws and Regulations
Even if an area has a high demand for short term rentals, you must first check the local laws and regulations regarding vacation rentals before investing. Some cities have strict Airbnb laws, which may make the area unfavorable for Airbnb investment. In cities where investing in Airbnb is illegal, renting out on a short term basis can lead to serious legal issues.
In other cities, Airbnb investment may not be illegal altogether, but harsh vacation rental regulations may adversely affect your return on investment. For instance, the taxes and fees you are expected to pay in a particular city will influence your Airbnb profit margin. Or you might be limited to renting for only a certain amount of days per year, which will impact your occupancy and income.
Before you decide to buy a vacation rental property in a particular housing market, be sure to research and understand the local Airbnb rules and regulations. Look to invest in cities with no Airbnb regulations.
To start your research, check out the Mashvisor short term rental regulations page. There you’ll find a summary of the laws in all the best Airbnb locations, along with links to more detailed resources.
5. Access to Public Transportation and Amenities
Airbnb guests care about having access to public transportation so they can get to their preferred tourist attractions easily and conveniently. It’s even better if the most popular places of interest are within walking distance.
Moreover, visitors choose to stay in areas with multiple amenities such as restaurants, shops, cafes, parks, gyms, commercial centers, museums, theaters, tourist centers, etc. In this way, they don’t need to waste time and money commuting.
So, make sure the area you intend to invest in provides future guests with the convenience they need.
6. Reasonable Property Prices
Another factor to consider in your Airbnb location selection is the prevailing home values in the area. The purchase property price determines whether you can afford a certain property based on your available capital. Furthermore, it affects the profitability of a short term rental property by setting both the cash down payment and the monthly mortgage payments.
The sales price is present in all metrics of return on investment in real estate. These include the cash on cash return and the cap rate. The less you pay for your investment property, the more return you will make on it.
7. Affordable Management Costs
Some of the best real estate deals may be found in areas far from where you live. If you are not going to live at the Airbnb property, you should factor in the cost of managing the rental.
When answering the question “Is my area good for Airbnb?”, you need to take into consideration the average Airbnb property management fees. Some markets with high costs of living tend to have more expensive management fees. Unless the rental income is big enough, it might not make sense to invest there to get only a fraction of the revenue while the property manager keeps the rest.
8. Strong ROI Metrics
The ultimate way how to know if an area is good for Airbnb is to find out what profit it brings to investors. It depends on all the factors discussed above and is the real determinant of whether a market is worth it for the short term rental strategy.
In your Airbnb rental market analysis, you have to check the cash flow that hosts can generate. This should be positive. You also need to look at the city-average cash on cash return and cap rate. A good cap rate is considered between 8% and 12%, while cash on cash return above 6% is usually great.
Sign up for Mashvisor now to become the proud owner of a profitable investment property in the top Airbnb locations this year.
Access complete Airbnb market data