With the rollout of the Covid-19 vaccine, the situation in the US housing market is expected to start coming back to normal soon. This includes the Airbnb industry which was disproportionately affected by the Coronavirus pandemic due to lockdowns, stay-at-home orders, and travelers’ concerns.
Indeed, Mashvisor nationwide real estate market analysis reveals that the Airbnb occupancy rate is expected to be back on a sustainable growth path by September 2021. So, if you’re thinking of investing in real estate this year, you should definitely consider buying an Airbnb property.
To help you locate a profitable investment opportunity, we provide you with a list of the 30 most profitable Airbnb locations for cash on cash return in the US market.
30 Most Profitable Airbnb Locations
As a real estate investor eager to buy Airbnb property, you must be curious to find out the top markets for this investment strategy right away. So, let’s take a look at the 30 locations promising the highest return on investment for short-term rentals this year.
Afterwards, we will discuss the real estate data used for this analysis, what these numbers mean, and other equally important considerations for Airbnb hosts.
1. San Angelo, TX
- Airbnb Cash on Cash Return: 7.6%
- Airbnb Occupancy Rate: 74%
- Airbnb Daily Rate: $123
- Airbnb Rental Income: $3,290
- Median Property Price: $361,600
- Average Price per Square Foot: $155
- Listings for Sale: 155
- Airbnb Listings: 171
- Average Days on Market: 283
- Walk Score: 33
2. Chesapeake, VA
- Airbnb Cash on Cash Return: 6.8%
- Airbnb Occupancy Rate: 69%
- Airbnb Daily Rate: $157
- Airbnb Rental Income: $3,500
- Median Property Price: $331,900
- Average Price per Square Foot: $171
- Listings for Sale: 167
- Airbnb Listings: 100
- Average Days on Market: 65
- Walk Score: 19
3. Valdosta, GA
- Airbnb Cash on Cash Return: 6.2%
- Airbnb Occupancy Rate: 70%
- Airbnb Daily Rate: $95
- Airbnb Rental Income: $2,180
- Median Property Price: $286,700
- Average Price per Square Foot: $107
- Listings for Sale: 105
- Airbnb Listings: 219
- Average Days on Market: 39
- Walk Score: 33
4. Canton, OH
- Airbnb Cash on Cash Return: 6.1%
- Airbnb Occupancy Rate: 54%
- Airbnb Daily Rate: $106
- Airbnb Rental Income: $2,970
- Median Property Price: $201,000
- Average Price per Square Foot: $10
- Listings for Sale: 190
- Airbnb Listings: 133
- Average Days on Market: 70
- Walk Score: 45
5. Portsmouth, VA
- Airbnb Cash on Cash Return: 6.1%
- Airbnb Occupancy Rate: 65%
- Airbnb Daily Rate: $126
- Airbnb Rental Income: $2,470
- Median Property Price: $213,600
- Average Price per Square Foot: $135
- Listings for Sale: 155
- Airbnb Listings: 237
- Average Days on Market: 61
- Walk Score: 25
6. Independence, MO
- Airbnb Cash on Cash Return: 6.0%
- Airbnb Occupancy Rate: 61%
- Airbnb Daily Rate: $107
- Airbnb Rental Income: $1,700
- Median Property Price: $192,100
- Average Price per Square Foot: $115
- Listings for Sale: 142
- Airbnb Listings: 417
- Average Days on Market: 57
- Walk Score: 29
7. Eau Claire, WI
- Airbnb Cash on Cash Return: 6.0%
- Airbnb Occupancy Rate: 65%
- Airbnb Daily Rate: $127
- Airbnb Rental Income: $2,640
- Median Property Price: $305,400
- Average Price per Square Foot: $143
- Listings for Sale: 101
- Airbnb Listings: 186
- Average Days on Market: 98
- Walk Score: 29
8. Fayetteville, NC
- Airbnb Cash on Cash Return: 5.9%
- Airbnb Occupancy Rate: 71%
- Airbnb Daily Rate: $98
- Airbnb Rental Income: $2,160
- Median Property Price: $223,300
- Average Price per Square Foot: $147
- Listings for Sale: 696
- Airbnb Listings: 1,472
- Average Days on Market: 78
- Walk Score: 24
9. Springfield, MO
- Airbnb Cash on Cash Return: 5.8%
- Airbnb Occupancy Rate: 59%
- Airbnb Daily Rate: $100
- Airbnb Rental Income: $2,230
- Median Property Price: $285,700
- Average Price per Square Foot: $122
- Listings for Sale: 194
- Airbnb Listings: 1,094
- Average Days on Market: 64
- Walk Score: 31
10. Fort Wayne, IN
- Airbnb Cash on Cash Return: 5.7%
- Airbnb Occupancy Rate: 68%
- Airbnb Daily Rate: $82
- Airbnb Rental Income: $2,290
- Median Property Price: $262,800
- Average Price per Square Foot: $125
- Listings for Sale: 444
- Airbnb Listings: 3,932
- Average Days on Market: 71
- Walk Score: 33
11. Jackson, MS
- Airbnb Cash on Cash Return: 5.7%
- Airbnb Occupancy Rate: 67%
- Airbnb Daily Rate: $97
- Airbnb Rental Income: $2,590
- Median Property Price: $280,000
- Average Price per Square Foot: $63
- Listings for Sale: 129
- Airbnb Listings: 1,688
- Average Days on Market: 127
- Walk Score: 24
12. Riverside, CA
- Airbnb Cash on Cash Return: 5.7%
- Airbnb Occupancy Rate: 67%
- Airbnb Daily Rate: $156
- Airbnb Rental Income: $4,470
- Median Property Price: $542,600
- Average Price per Square Foot: $308
- Listings for Sale: 556
- Airbnb Listings: 162
- Average Days on Market: 51
- Walk Score: 35
13. Johnson City, TN
- Airbnb Cash on Cash Return: 5.7%
- Airbnb Occupancy Rate: 61%
- Airbnb Daily Rate: $109
- Airbnb Rental Income: $2,110
- Median Property Price: $304,000
- Average Price per Square Foot: $119
- Listings for Sale: 120
- Airbnb Listings: 110
- Average Days on Market: 67
- Walk Score: 30
14. Richardson, TX
- Airbnb Cash on Cash Return: 5.7%
- Airbnb Occupancy Rate: 67%
- Airbnb Daily Rate: $193
- Airbnb Rental Income: $3,470
- Median Property Price: $401,900
- Average Price per Square Foot: $187
- Listings for Sale: 127
- Airbnb Listings: 420
- Average Days on Market: NA
- Walk Score: 38
15. Arlington, TX
- Airbnb Cash on Cash Return: 5.6%
- Airbnb Occupancy Rate: 62%
- Airbnb Daily Rate: $180
- Airbnb Rental Income: $2,750
- Median Property Price: $318,800
- Average Price per Square Foot: $150
- Listings for Sale: 450
- Airbnb Listings: 1,302
- Average Days on Market: 74
- Walk Score: 41
16. Akron, OH
- Airbnb Cash on Cash Return: 5.6%
- Airbnb Occupancy Rate: 58%
- Airbnb Daily Rate: $85
- Airbnb Rental Income: $1,650
- Median Property Price: $150,400
- Average Price per Square Foot: $97
- Listings for Sale: 249
- Airbnb Listings: 224
- Average Days on Market: 61
- Walk Score: 48
17. Bakersfield, CA
- Airbnb Cash on Cash Return: 5.5%
- Airbnb Occupancy Rate: 74%
- Airbnb Daily Rate: $135
- Airbnb Rental Income: $3,020
- Median Property Price: $381,000
- Average Price per Square Foot: $186
- Listings for Sale: 212
- Airbnb Listings: 447
- Average Days on Market: 67
- Walk Score: 28
18. Ypsilanti, MI
- Airbnb Cash on Cash Return: 5.4%
- Airbnb Occupancy Rate: 67%
- Airbnb Daily Rate: $155
- Airbnb Rental Income: $2,490
- Median Property Price: $279,000
- Average Price per Square Foot: $157
- Listings for Sale: 102
- Airbnb Listings: 286
- Average Days on Market: 86
- Walk Score: 41
19. Richmond, VA
- Airbnb Cash on Cash Return: 5.4%
- Airbnb Occupancy Rate: 65%
- Airbnb Daily Rate: $140
- Airbnb Rental Income: $2,940
- Median Property Price: $369,300
- Average Price per Square Foot: $198
- Listings for Sale: 790
- Airbnb Listings: 4,061
- Average Days on Market: 97
- Walk Score: 46
20. Hattiesburg, MS
- Airbnb Cash on Cash Return: 5.3%
- Airbnb Occupancy Rate: 60%
- Airbnb Daily Rate: $98
- Airbnb Rental Income: $1,980
- Median Property Price: $268,100
- Average Price per Square Foot: $104
- Listings for Sale: 156
- Airbnb Listings: 405
- Average Days on Market: 81
- Walk Score: 34
21. Visalia, CA
- Airbnb Cash on Cash Return: 5.3%
- Airbnb Occupancy Rate: 78%
- Airbnb Daily Rate: $84
- Airbnb Rental Income: $2,700
- Median Property Price: $394,200
- Average Price per Square Foot: $183
- Listings for Sale: 137
- Airbnb Listings: 114
- Average Days on Market: 84
- Walk Score: 47
22. Columbus, GA
- Airbnb Cash on Cash Return: 5.2%
- Airbnb Occupancy Rate: 67%
- Airbnb Daily Rate: $98
- Airbnb Rental Income: $1,830
- Median Property Price: $254,800
- Average Price per Square Foot: $114
- Listings for Sale: 137
- Airbnb Listings: 722
- Average Days on Market: 95
- Walk Score: 34
23. Springfield, IL
- Airbnb Cash on Cash Return: 5.2%
- Airbnb Occupancy Rate: 63%
- Airbnb Daily Rate: $100
- Airbnb Rental Income: $1,570
- Median Property Price: $162,600
- Average Price per Square Foot: $85
- Listings for Sale: 138
- Airbnb Listings: 1,094
- Average Days on Market: 94
- Walk Score: 40
24. Roanoke, VA
- Airbnb Cash on Cash Return: 5.2%
- Airbnb Occupancy Rate: 68%
- Airbnb Daily Rate: $106
- Airbnb Rental Income: $2,410
- Median Property Price: $322,900
- Average Price per Square Foot: $130
- Listings for Sale: 101
- Airbnb Listings: 926
- Average Days on Market: 138
- Walk Score: 37
25. Reno, NV
- Airbnb Cash on Cash Return: 5.1%
- Airbnb Occupancy Rate: 65%
- Airbnb Daily Rate: $142
- Airbnb Rental Income: $3,510
- Median Property Price: $381,900
- Average Price per Square Foot: $284
- Listings for Sale: 402
- Airbnb Listings: 207
- Average Days on Market: 87
- Walk Score: 12
26. Tucson, AZ
- Airbnb Cash on Cash Return: 5.1%
- Airbnb Occupancy Rate: 65%
- Airbnb Daily Rate: $102
- Airbnb Rental Income: $2,520
- Median Property Price: $320,700
- Average Price per Square Foot: $170
- Listings for Sale: 903
- Airbnb Listings: 6,388
- Average Days on Market: 51
- Walk Score: 40
27. Norfolk, VA
- Airbnb Cash on Cash Return: 5.1%
- Airbnb Occupancy Rate: 62%
- Airbnb Daily Rate: $158
- Airbnb Rental Income: $2,570
- Median Property Price: $308,400
- Average Price per Square Foot: $167
- Listings for Sale: 267
- Airbnb Listings: 1,606
- Average Days on Market: 77
- Walk Score: 41
28. San Marcos, TX
- Airbnb Cash on Cash Return: 5.0%
- Airbnb Occupancy Rate: 46%
- Airbnb Daily Rate: $177
- Airbnb Rental Income: $3,120
- Median Property Price: $324,900
- Average Price per Square Foot: $171
- Listings for Sale: 157
- Airbnb Listings: 313
- Average Days on Market: 107
- Walk Score: 33
29. Chico, CA
- Airbnb Cash on Cash Return: 5.0%
- Airbnb Occupancy Rate: 69%
- Airbnb Daily Rate: $152
- Airbnb Rental Income: $3,560
- Median Property Price: $535,700
- Average Price per Square Foot: $300
- Listings for Sale: 200
- Airbnb Listings: 255
- Average Days on Market: 62
- Walk Score: 62
30. Wichita, KS
- Airbnb Cash on Cash Return: 5.0%
- Airbnb Occupancy Rate: %66
- Airbnb Daily Rate: $95
- Airbnb Rental Income: $2,030
- Median Property Price: $240,700
- Average Price per Square Foot: $111
- Listings for Sale: 145
- Airbnb Listings: 881
- Average Days on Market: 81
- Walk Score: 36
What About Airbnb Laws and Regulations in These Markets?
Before we move further into our discussion on the best cities for Airbnb investment, we should talk about the short-term rentals regulations in these profitable locations.
The amazing growth of the Airbnb rental industry since 2008 caused the US hotel lobby as well as residents in many US major cities and hot tourist destinations to force local authorities to impose strict regulations and even prohibitions on vacation home rentals. The result was a wave of Airbnb laws across the US real estate market which limit short-term rental properties to different degrees.
When it comes to the top 30 most profitable Airbnb locations, it’s important to note that some of them face regulations and restrictions on the renting of investment properties on Airbnb and other similar vacation rental platforms.
Thus, as a savvy investor and a smart Airbnb host, you should check out local Airbnb laws and regulations before deciding to own an Airbnb investment property in any of these markets. You should also consider hiring a professional vacation rental management company.
Property managers with experience in and knowledge of the local housing market will be able to give you the best advice on how to own a profitable short-term rental property without getting in trouble with the authorities.
Moreover, working with a professional property manager will give you the opportunity to turn your rental property into a passive real estate investment without compromising the expected rate of return.
Why Do We Look at the Airbnb Cash on Cash Return?
Another question which might be poking the brains of eager real estate investors is why we are determining the most profitable Airbnb locations based on the cash on cash return and not another metric of profitability such as the Airbnb daily rate, the Airbnb income, the Airbnb occupancy rate, the Airbnb cash flow, or the Airbnb cap rate.
While CoC return is just one of the many measures of return on investment in real estate, it is the most comprehensive one. The cash on cash return formula allows investors to evaluate the investment potential of an Airbnb business endeavor based on how much money they will be able to make from it taking into consideration the property price, the one-time startup costs, the recurring monthly expenses, the rental income, and – importantly – the method of financing.
For example, metrics such as the Airbnb daily rate and the Airbnb occupancy rate are crucial factors in determining the profitability of an Airbnb investment, but they don’t tell the full story. Airbnb cash flow is a bit more thorough but still does not reveal the return compared to the property price.
The Airbnb cap rate does that but discards the method of financing of a rental property: cash vs. mortgage. As most beginner investors have to rely on taking a loan, financing cannot be disregarded.
Meanwhile, the Airbnb CoC return takes into account all these major factors to provide an all-inclusive measure of return on investment, whether we are looking at traditional or Airbnb rental properties.
What Airbnb Data Is Used for These Calculations?
Nowadays, data is power. With the advancement of big data, artificial intelligence, and predictive analytics, the world of real estate investing has been majorly transformed. Successful investors will be those who get their hands on the most reliable and trustworthy sources of real estate data.
That’s why it’s important to explain where the data for the list of the 30 most profitable Airbnb locations comes from.
The Airbnb data provided above has been collected and analyzed by the Mashvisor real estate investment software. We gather real estate and rental data from dozens of reliable, publicly available sources such as Airbnb.com, the MLS, and others before applying our machine-learning algorithms to provide investors with top-notch Airbnb analytics.
The Mashvisor Airbnb data analytics are based on the performance of actual Airbnb listings in each market. We obtain our Airbnb rental comps right from the Airbnb website, which ensures data accuracy and reliability.
What Characterizes the Best Cities for Airbnb Investment?
Let’s next have a look at some of the most prominent trends in the Airbnb market in the US:
Surprising Airbnb Cities and States
First and foremost, the most profitable Airbnb locations are rather surprising. These are definitely not the markets which come to mind when you think about the boom of the short-term rental industry such as Airbnb Los Angeles, Airbnb New York City, Airbnb San Francisco, Airbnb Dallas, Airbnb Atlanta, and Airbnb Las Vegas.
There are a few reasons for this trend. Importantly, non-owner occupied short-term rentals have been declared illegal in many of these previously top markets, which caused investors to look into other places. Furthermore, these cities usually offer prohibitively high real estate prices, which affect negatively the return on investment.
The important takeaway for beginner investors is to not underestimate the importance of smaller markets when going for the Airbnb investment strategy.
Wide Geographical Distribution
Second, the markets which offer the highest rate of return for vacation home rentals are distributed throughout the entire US housing market. This is great news for investors who’d rather stay away from out of state real estate investing and prefer to buy a rental property close to home.
Nevertheless, a few states emerge as the most profitable for Airbnb investments this year. The Virginia real estate market is a definite winner as it hosts 5 of the top Airbnb locations, followed by the Texas housing market and the California housing market, which are each home to 4 of these locations. The Ohio real estate market, the Georgia housing market, and the Mississippi real estate market are definitely worth keeping an eye on as well.
Surprisingly, the Florida real estate market has dropped off from the list of the best places to invest in Airbnb. Actually, vacation rentals in the Sunshine State were disproportionately affected by the Covid-19 pandemic.
Even by September 2020, when the Airbnb occupancy rate has entered a recovery mode in the majority of US markets, Florida was lagging behind. However, the rollout of the Coronavirus vaccine is expected to change this recent trend and bring Florida back on the map of the most profitable locations for Airbnb.
Secondary and Tertiary Real Estate Markets
As already hinted above, the list of the 30 best markets for short-term rental property investments is made up of mostly tertiary but also some secondary markets in real estate, rather than primary markets.
One of the leading reasons for this has been the pandemic which hit US large cities stronger than smaller towns. With the new reality of remote working, many professionals are escaping from the overpriced cities to more affordable and safer locations and are looking for long-term Airbnb rentals. Suburban markets have benefited from this reality both with regards to long-term and short-term rental properties.
Major Changes Since 2020
Nationwide real estate market analysis comparing 2021 with 2020 will reveal significant departures from the performance of Airbnb rentals since last year. This is only expected in such a volatile situation as a global pandemic.
Importantly, the list of the most profitable Airbnb locations has completely changed from 2020 to 2021. Moreover, the average return on investment has dropped. Last year the 20 best markets for investing in an Airbnb for sale boasted a double-digit cash on cash return, reaching as high as 17.5% in Tuscaloosa, AL.
This year, the CoC return in the top 30 places ranges from 5.0% in the Wichita real estate market to 7.6% in the San Angelo housing market. Nevertheless, investors should keep in mind that these are just city averages, while individual investment properties for sale still offer double-digit returns.
Strong Airbnb Occupancy Rates
As mentioned before, the Airbnb occupancy rate is one of the main determinants of how much money you will be able to make with a vacation home rental. As expected, all the best locations for this rental strategy offer high occupancy rates: from 46% in San Marcos, TX to 78% in Visalia, CA.
Of course, as an individual investor, you can work on making your property stand out from the rest of the Airbnb listings in the area or even hire a professional property manager to push your occupancy rate up. This will inevitably increase your Airbnb income and profitability as well.
Affordable Home Prices
Last but not least, these places provide investors with below-average property prices. This is an important consideration for first-time real estate investors and others who have a limited budget.
Furthermore, low home values help Airbnb hosts push their return on investment up, regardless of whether they look at cash on cash return or cap rate. The 30 markets listed above offer house prices running from $150,400 in the Akron housing market to $581,900 in the Reno real estate market.
How to Buy a Top-Performing Airbnb Rental Property in the US Housing Market
Knowing the most profitable Airbnb locations is the first step in owning an Airbnb property that generates profit month after month. However, it is not enough to make a profitable investment decision.
Here are the main steps you have to go through in order to ensure a lucrative short-term rental property investment:
Real Estate Market Analysis
Buying a top-performing Airbnb property starts with analyzing the US market as a whole and identifying the most profitable locations which fit your budget and expectations. You can skip this step as you already know which cities and towns promise the highest return.
Now it’s time to choose a couple of these locations which fit your requirements as an investor and conduct deeper real estate market analysis on them. Since we are looking at vacation home rentals, it’s crucial to research the Airbnb legal issues to make sure that you can own an Airbnb property there.
Neighborhood Analysis
Once you’ve completed the previous step, you should move to neighborhood analysis. Even if you know the market you want to invest in, you’ll soon figure out that different areas within the same city offer very different rates of return on short-term rentals. Moreover, they come with different property prices which affects affordability.
Analyzing several neighborhoods will take lots of time and energy unless you make use of the best real estate investment tools for this kind of job. Mashvisor’s real estate heatmap will provide you with a quick visualization of the best areas to search for Airbnb rental properties for sale based on a number of criteria including:
- Listing prices
- Airbnb rental income
- Airbnb occupancy rate
- Airbnb cash on cash return
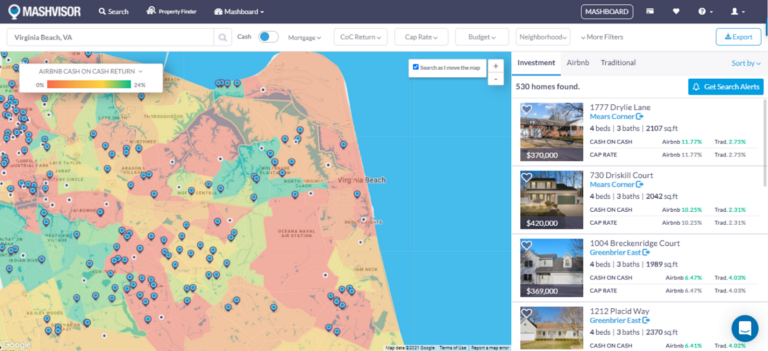
Mashvisor’s Real Estate Heatmap
In this way, you can quickly identify a few areas that match your investor expectations and focus your neighborhood analysis on them.
Mashvisor’s neighborhood pages will provide you with readily available Airbnb data analytics for each area within a US city. Some of the Airbnb information which you will be able to get includes:
- Median property price
- Average price per square foot
- Airbnb rental income
- Airbnb occupancy rate
- Airbnb cash on cash return
- Number of Airbnb listings
- Number of investment properties for sale
- Optimal rental strategy: Airbnb vs. traditional
- Airbnb rental comps
- Walk Score
- Optimal property type
- Optimal number of bedrooms
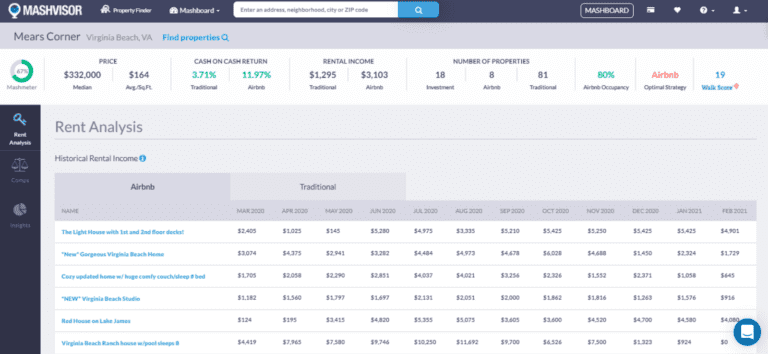
Mashvisor’s Neighborhood Analysis Pages
All these factors will help you confirm if this neighborhood is the best area to focus your Airbnb investment property search efforts on.
Investment Property Search
As soon as you know where you want to invest in real estate to rent out on a short-term basis, you should start your rental property search. Mashvisor’s search engine will allow you to enter your criteria to provide you with the investment properties for sale which match your expectations. Some of the factors include:
- Budget
- Expected Airbnb income
- Expected Airbnb cash on cash return
- Expected Airbnb cap rate
- Number of bedrooms and bathrooms
- Year built
- Property size
- Property type: single-family home, townhouse, condo, apartment, multi-family home, etc.
- Listing type: for sale, pending, or foreclosure
- Financing method: cash vs. mortgage
To get access to our real estate investment tools, click here to sign up for a 7-day free trial of Mashvisor today and enjoy 15% off for life.
Rental Property Analysis
Now we come to the most important step in buying a profitable Airbnb property: the investment property analysis. This is a detailed analysis of all the property features as well as all the factors that play a role in determining the return on investment.
To be able to conduct rental property analysis on a number of different vacation homes to choose the best one for your particular situation, you should use Mashvisor’s Airbnb profit calculator. This investment property calculator will provide you with all the information you can possibly need to make a profitable investment decision.
For each property listed on the Mashvisor platform as well as for each property whose address you enter, you will get immediate access to the following Airbnb data (and this is not an exhaustive list):
- Property address
- Property type
- Property characteristics
- Property description
- Number of bedrooms and bathrooms
- Listing price
- Traditional and Airbnb comparable rental income
- Traditional and Airbnb cash flow
- Traditional and Airbnb cash on cash return
- Traditional and Airbnb cap rate
- Traditional and Airbnb occupancy rate
- One-time startup costs: home inspection, repair, furniture, appliances, and closing costs
- Recurring monthly expenses: property insurance, utilities, professional property management, property maintenance, property tax, HOA fees, rental income tax, and cleaning fees
- Mortgage calculator including method of financing, down payment, mortgage type, loan term, and interest rate
- Investment payback balance
- Real estate comps
- Traditional and Airbnb rental comps
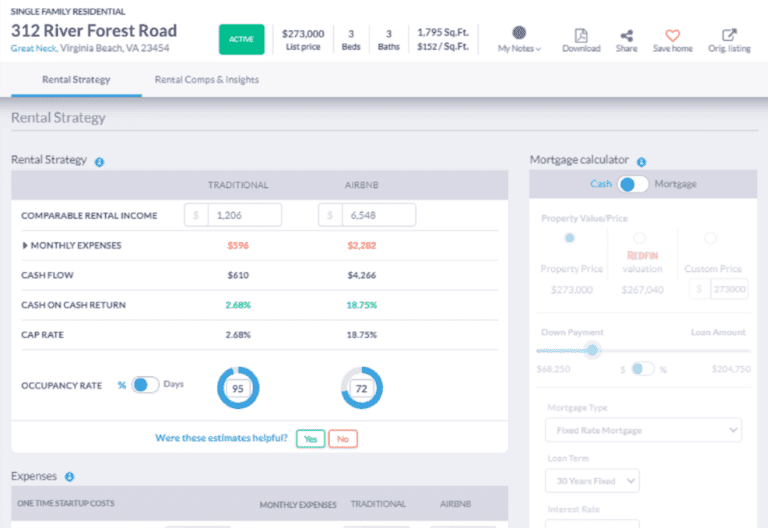
Mashvisor’s Airbnb Profit Calculator
Importantly, the Mashvisor rental property calculator allows investors to change any of the metrics if they have a reason to believe that they will be able to achieve a better occupancy rate, if they want to include property management, or if they plan to do major renovations on the property, for example. As soon as you modify any of the metrics, all calculations will be automatically redone to provide you with updated estimates of return on investment.
If you are planning to buy an Airbnb property, the best advice you will hear is to get access to the top real estate investment tools. This will help you not only save time and energy but also ensure that your analysis is complete and accurate.
So, these are the 30 most profitable Airbnb locations based on cash on cash return. If you want to start making money from short-term rental properties this year, focus your efforts on these markets.
Sign up for Mashvisor to take your real estate research and analysis to the next level. Your lucrative Airbnb property is just a few clicks away.