Is Airbnb profitable? Can real estate investors still make money from this rental strategy in 2026?
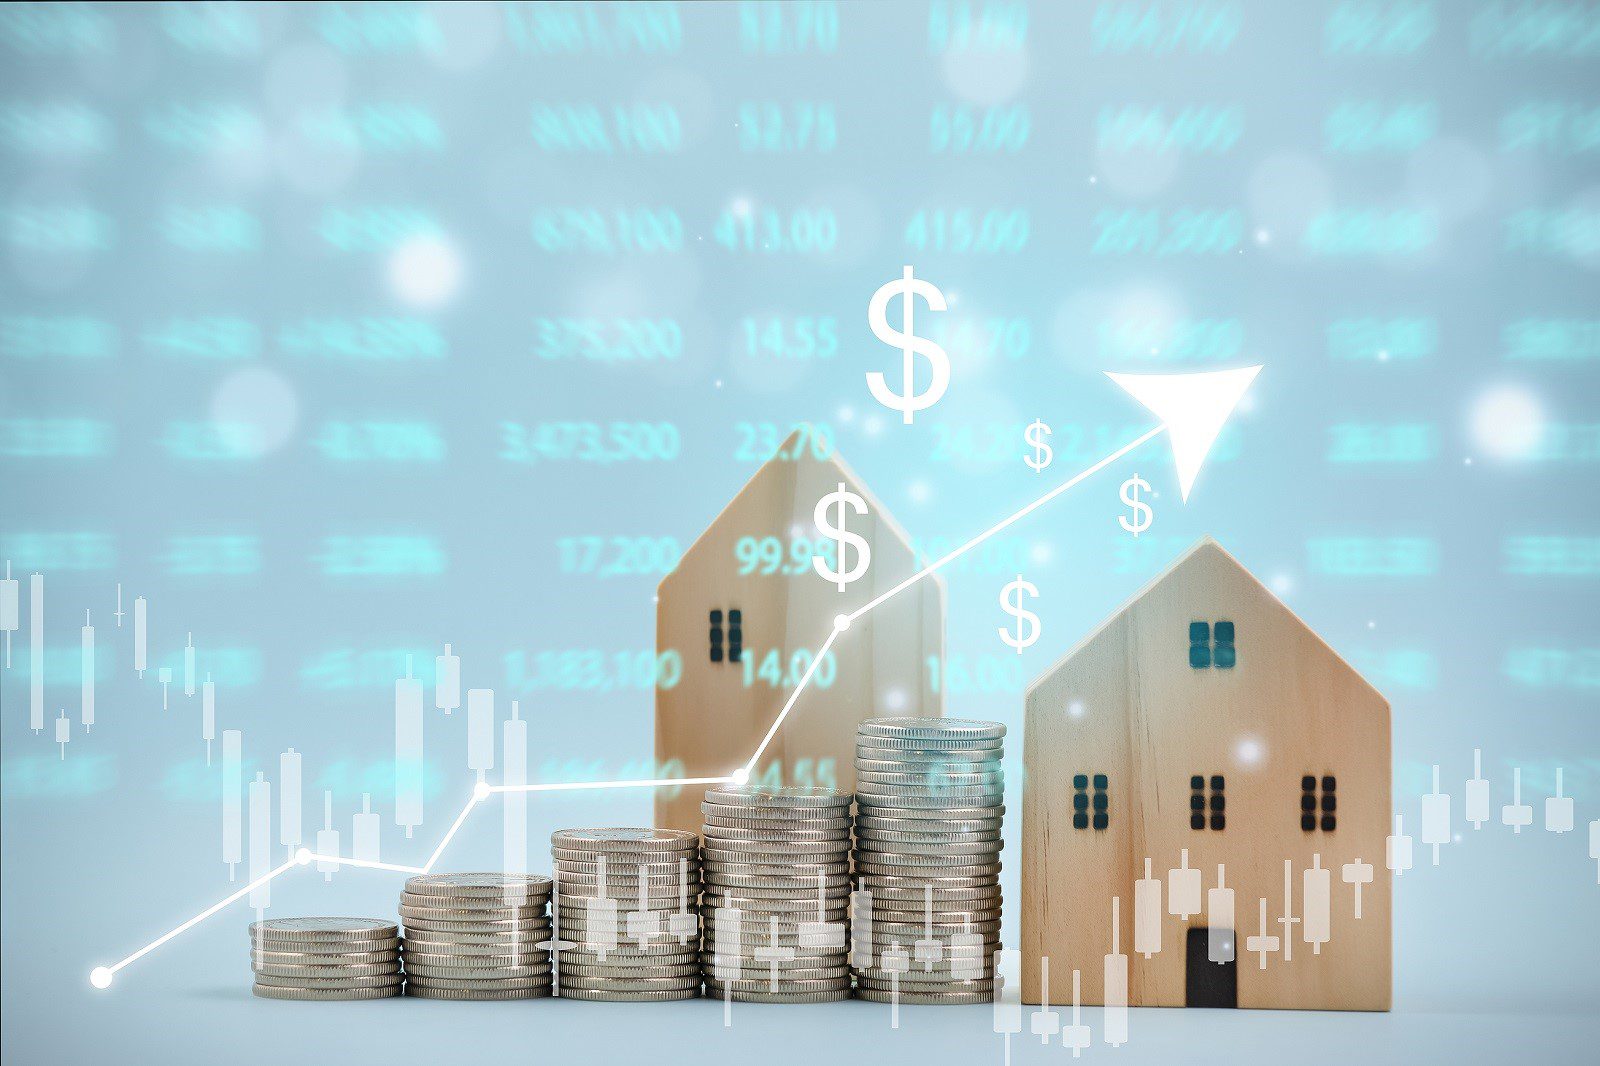
The short answer is yes, absolutely.
So why are you seeing so much talk online about the collapse of the Airbnb market, you ask? Let’s dive into this and find out just how profitable Airbnb investment properties will be in 2026.
We’ll also look at what aspiring investors can do to determine the profitability of a property before buying it and how they can push its performance. And to get you started today, we’ve put together a list of the best Airbnb markets where this rental strategy is still profitable.
Table of Contents
- Is Airbnb Still Profitable?
- How to Determine Airbnb Profitability
- Where Is Airbnb Profitable?: Mashvisor’s Airbnb Data by City
Is Airbnb Still Profitable?
Airbnb is still profitable and the real estate data shows this to be true. The short term rental company reviews overall worldwide performance quarterly and some stats included in the report provide insights into just how profitable Airbnb is for hosts. Here are some of the key numbers from Q3 2025 explained:
- “Q3 Nights and Seats booked were 133.6M, up 9% year-over-year”: Bookings for both nightly stays as well as Airbnb experiences went up 9% in Q3 2025. This translates to an increased demand for vacation rentals in Global and US markets.
- “Gross booking value (GBV) grew 14% year-over-year to $22.9 billion”: This stat refers to how much money was generated by hosts before Airbnb took a cut. When we combine this with the fact that Airbnb’s revenue for Q3 was $4.1 billion, we can roughly say that hosts took home $18.8 billion.
If we stop here and think about how the number of Airbnb rental listings has exploded in some markets, the previous numbers might only point to the fact that the Airbnb company itself is doing well while hosts are making less. And this major increase in competition along with the rise of strict regulations and higher fees is what has brought about the talk of the downfall of the Airbnb market.
However, there is more Airbnb data to consider:
- “Active listings grew by 10% in Q3 2025 compared to a year ago, with double-digit supply growth across all regions”: Even though listings grew, the GBV’s growth continued to outpace it pointing to the fact that many Airbnb hosts are taking home high revenue and a good ROI.
- “ADR (Gross Booking Value per Night and Experience Booked) was $171.3, up 4.7% on a year-over-year basis”: The average daily rate (ADR) increased due to price appreciation, according to the report. This means hosts successfully increased their prices without hurting bookings.
To sum this up in one line: Airbnb is profitable.
Not only for the company but for hosts as well. And with the announcement of new growth strategies for 2026 like moving towards a “more complete travel ecosystem” and AI integration, next year is sure to bring in high Airbnb profits for hosts.
Of course, when looking at these numbers, a future host should keep in mind that they are a broad picture but they do tell a story of personal profit potential.
How Profitable Is Airbnb for the Individual Host?
Will Airbnb be profitable for you?
That depends on a lot of different factors:
- The Location of Your Airbnb Business: Certain markets are much better suited for this real estate investing strategy than others and result in significantly higher profits thanks to high demand for vacation rentals.
- Your Rental Property: Some individual properties are also a better fit than others due to their specific location, the property type, the property size, the amenities, etc. The right combination of these can result in a high Airbnb occupancy rate and double-digit cash on cash return and cap rate.
- The Airbnb Property Management: Everything from your Airbnb pricing strategy to the hosting style will affect how profitable your short term rental property will be.
So, as long as you conduct the required market and property analysis, use the correct data, and benefit from available tools, you can make a very profitable Airbnb investment. In other words, investors need to know how to go about evaluating Airbnb profitability.
How to Determine Airbnb Profitability
Now we change our question from “Is Airbnb profitable” to “How do I find a profitable Airbnb rental property?”
Here, we’ll look at the steps you need to take to determine the profitability of a vacation rental and how Mashvisor’s tools can help you along the way.
Airbnb Market Analysis
Not all locations are ideal for short term rentals. This holds true for both the city level and the neighborhood level. But then there are some locations where vacation rental investing and Airbnbs are more profitable than renting.
When analyzing the potential of an Airbnb market, you have to look at things like the tourism stats, attractions, crime rate, and short term rental regulations. But you also have to consider reliable short term rental data like property prices, average Airbnb rental income, and average return on investment.
If you’re a beginner looking for the best areas for vacation rental investments, you can use the Mashvisor Market Finder to search for cities and neighborhoods that match your budget, desired property type, and even your ideal ROI. All you need to do is to enter your criteria to get a list of the best US Airbnb markets.
Then, you can visit the Mashvisor neighborhood analysis pages to zoom in on a more detailed analysis of the areas that catch your eye. You will find all the data points you need (occupancy rates, historical rental income, Airbnb vs long-term rental returns, etc.) to identify the most profitable area for running an Airbnb.
To start finding and analyzing the best Airbnb markets across the US, sign up for a 7-day free trial of Mashvisor, followed by a 15% discount.
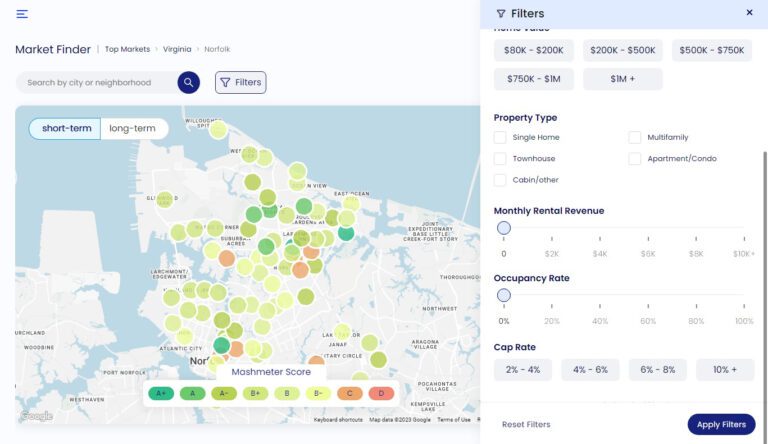
Where is Airbnb profitable? Let Mashvisor’s Market Finder help you find the ideal location for Airbnb investing. Its features allow you to customize your search for more accurate results.
Airbnb Investment Property Analysis
The great thing about Mashvisor’s tools? You can stay on our platform after finding a market and start looking at properties right away. Simply click “View Properties” in the neighborhood you landed on in your Airbnb market analysis.
This will take you to the Mashvisor Property Finder where you can easily locate profitable opportunities within your budget. Then, you can access detailed investment property analysis for each property that grabs your attention. This analysis includes price, income, expenses, cash flow, cash on cash return, cap rate, and occupancy rate. All the analytics provided are from the Mashvisor short term rental calculator which reflects actual listings in the neighborhood. It also comes with long term rental analysis to confirm if this specific property is more profitable when renting out on a short term or long term basis.
Maybe you already know the market where you want to invest and have a property in mind. Well, hosts can use the Mashvisor Airbnb Calculator to analyze the profitability potential of any residential property in the US based on its street address, number of bedrooms, and number of bathrooms. Entering these three simple values will give them access to the forecast occupancy rate, daily rate, and rental income.
The estimated numbers are based on the performance of active Airbnb rentals in the area similar to the property you’re analyzing. In real estate, these are known as rental comps, and using rental comps is the most accurate way to perform rental property analysis.
Airbnb Rental Calculator
Bedrooms
Bathrooms
 Bedrooms
 Bathrooms
Airbnb Pricing Analysis
The last major component you need to incorporate into determining the profitability of an Airbnb investment is pricing. How you price your property is crucial for enhancing its ROI. Competitive daily rates make the Airbnb algorithm rank your listing higher in search results. It also makes guests choose your rental over competitors. It means more bookings and more income.
Nevertheless, if the rate is too low, you are leaving money on the table. In addition, your nightly rate should not be flat but constantly adjusted to highlight changes in local supply and demand.
To determine the pricing of your property and how it will affect its profit, you need to look at rental comps. The Mashvisor Dynamic Pricing tool can help with this. You can link your Airbnb listings directly to your Mashvisor account to see what daily rates make the most sense for your property based on comps in the area.
And that’s not all. You can set up full automation so that the Mashvisor tool adjusts your nightly pricing each day your property is available for rent. Using AI-driven technology, Mashvisor ensures that the dynamic pricing strategy maximizes the rental income and profitability of your short term rental.
This sets us apart from other similar tools that emphasize occupancy instead. But maximum occupancy doesn’t mean maximum profit if the nightly price is too low.
Where Is Airbnb Profitable?: Mashvisor’s Airbnb Data by City
“Where do I buy the right investment property for Airbnb hosting?”
Investors look at a few different metrics before choosing a location but the most important one is arguably the cash on cash return. Cash on cash return is a way to measure your rate of return by calculating the cash income you earned on the cash you invested in a property. Using Mashvisor’s nationwide data from November 2025, we have ranked the best short term rental markets based on CoC return.
To further ensure you find the most profitable investment opportunities, we focused on cities with affordable property prices (below $1,000,000) and strong demand (occupancy rate above 50%).
This list of best places to invest in Airbnb is based on numbers alone. Each location has its own laws and regulations that you must be aware of before buying a rental property to use as an Airbnb. Be sure to check them out before investing in any particular market. You can visit the Mashvisor short term rental regulations page to get started.
Top 30 Airbnb Locations With the Highest Cash on Cash Return
1. Zephyrhills, FL
Airbnb Cash on Cash Return: 7.32%
- Median Property Price: $334,779
- Price per Square Foot: $198
- Number of Airbnb Listings: 118
- Monthly Airbnb Rental Income: $3,695
- Airbnb Daily Rate: $132
- Airbnb Occupancy Rate: 69%
- Walk Score: 55
2. Winter Haven, FL
Airbnb Cash on Cash Return: 7.07%
- Median Property Price: $381,369
- Price per Square Foot: $200
- Number of Airbnb Listings: 164
- Monthly Airbnb Rental Income: $4,083
- Airbnb Daily Rate: $162
- Airbnb Occupancy Rate: 77%
- Walk Score: 77
3. Lauderhill, FL
Airbnb Cash on Cash Return: 6.44%
- Median Property Price: $246,790
- Price per Square Foot: $193
- Number of Airbnb Listings: 1,716
- Monthly Airbnb Rental Income: $3,361
- Airbnb Daily Rate: $206
- Airbnb Occupancy Rate: 65%
- Walk Score: 39
4. Sun City Center, FL
Airbnb Cash on Cash Return: 6.30%
- Median Property Price: $297,923
- Price per Square Foot: $181
- Number of Airbnb Listings: 107
- Monthly Airbnb Rental Income: $3,303
- Airbnb Daily Rate: $246
- Airbnb Occupancy Rate: 57%
- Walk Score: 38
5. Homosassa, FL
Airbnb Cash on Cash Return: 6.08%
- Median Property Price: $445,556
- Price per Square Foot: $253
- Number of Airbnb Listings: 175
- Monthly Airbnb Rental Income: $3,896
- Airbnb Daily Rate: $201
- Airbnb Occupancy Rate: 57%
- Walk Score: 32
6. Spring Hill, FL
Airbnb Cash on Cash Return: 5.94%
- Median Property Price: $376,748
- Price per Square Foot: $206
- Number of Airbnb Listings: 279
- Monthly Airbnb Rental Income: $3,475
- Airbnb Daily Rate: $179
- Airbnb Occupancy Rate: 61%
- Walk Score: 36
7. Inverness, FL
Airbnb Cash on Cash Return: 5.91%
- Median Property Price: $334,126
- Price per Square Foot: $208
- Number of Airbnb Listings: 140
- Monthly Airbnb Rental Income: $3,048
- Airbnb Daily Rate: $163
- Airbnb Occupancy Rate: 64%
- Walk Score: 33
8. Port Richey, FL
Airbnb Cash on Cash Return: 5.79%
- Median Property Price: $284,802
- Price per Square Foot: $206
- Number of Airbnb Listings: 174
- Monthly Airbnb Rental Income: $2,817
- Airbnb Daily Rate: $163
- Airbnb Occupancy Rate: 59%
- Walk Score: 47
9. Seffner, FL
Airbnb Cash on Cash Return: 5.78%
- Median Property Price: $466,442
- Price per Square Foot: $230
- Number of Airbnb Listings: 56
- Monthly Airbnb Rental Income: $4,031
- Airbnb Daily Rate: $162
- Airbnb Occupancy Rate: 62%
- Walk Score: 41
10. Warner Robins, GA
Airbnb Cash on Cash Return: 5.63%
- Median Property Price: $267,072
- Price per Square Foot: $137
- Number of Airbnb Listings: 121
- Monthly Airbnb Rental Income: $2,300
- Airbnb Daily Rate: $136
- Airbnb Occupancy Rate: 54%
- Walk Score: 37
11. Holiday, FL
Airbnb Cash on Cash Return: 5.55%
- Median Property Price: $287,010
- Price per Square Foot: $209
- Number of Airbnb Listings: 388
- Monthly Airbnb Rental Income: $2,660
- Airbnb Daily Rate: $155
- Airbnb Occupancy Rate: 59%
- Walk Score: 74
12. Vilano Beach, FL
Airbnb Cash on Cash Return: 5.44%
- Median Property Price: $741,413
- Price per Square Foot: $305
- Number of Airbnb Listings: 1,814
- Monthly Airbnb Rental Income: $5,265
- Airbnb Daily Rate: $212
- Airbnb Occupancy Rate: 62%
- Walk Score: 12
13. Weeki Wachee, FL
Airbnb Cash on Cash Return: 5.40%
- Median Property Price: $460,400
- Price per Square Foot: $247
- Number of Airbnb Listings: 29
- Monthly Airbnb Rental Income: $3,746
- Airbnb Daily Rate: $186
- Airbnb Occupancy Rate: 62%
- Walk Score: 33
14. Palm Springs, FL
Airbnb Cash on Cash Return: 5.35%
- Median Property Price: $289,009
- Price per Square Foot: $235
- Number of Airbnb Listings: 462
- Monthly Airbnb Rental Income: $3,108
- Airbnb Daily Rate: $210
- Airbnb Occupancy Rate: 54%
- Walk Score: 40
15. Milton, FL
Airbnb Cash on Cash Return: 5.33%
- Median Property Price: $365,474
- Price per Square Foot: $192
- Number of Airbnb Listings: 130
- Monthly Airbnb Rental Income: $3,001
- Airbnb Daily Rate: $184
- Airbnb Occupancy Rate: 55%
- Walk Score: 45
16. Palm Harbor, FL
Airbnb Cash on Cash Return: 5.24%
- Median Property Price: $501,307
- Price per Square Foot: $277
- Number of Airbnb Listings: 240
- Monthly Airbnb Rental Income: $4,193
- Airbnb Daily Rate: $238
- Airbnb Occupancy Rate: 60%
- Walk Score: 64
17. Seminole, FL
Airbnb Cash on Cash Return: 4.88%
- Median Property Price: $481,579
- Price per Square Foot: $279
- Number of Airbnb Listings: 317
- Monthly Airbnb Rental Income: $3,958
- Airbnb Daily Rate: $258
- Airbnb Occupancy Rate: 59%
- Walk Score: 80
18. Ponte Vedra, FL
Airbnb Cash on Cash Return: 4.87%
- Median Property Price: $815,033
- Price per Square Foot: $316
- Number of Airbnb Listings: 204
- Monthly Airbnb Rental Income: $5,940
- Airbnb Daily Rate: $309
- Airbnb Occupancy Rate: 51%
- Walk Score: 41
19. Fort Walton Beach, FL
Airbnb Cash on Cash Return: 4.85%
- Median Property Price: $549,990
- Price per Square Foot: $404
- Number of Airbnb Listings: 1,326
- Monthly Airbnb Rental Income: $4,244
- Airbnb Daily Rate: $245
- Airbnb Occupancy Rate: 54%
- Walk Score: 60
20. Port Orange, FL
Airbnb Cash on Cash Return: 4.84%
- Median Property Price: $488,349
- Price per Square Foot: $1,784
- Number of Airbnb Listings: 423
- Monthly Airbnb Rental Income: $3,676
- Airbnb Daily Rate: $193
- Airbnb Occupancy Rate: 52%
- Walk Score: 41
21. Jonesboro, AR
Airbnb Cash on Cash Return: 4.82%
- Median Property Price: $320,270
- Price per Square Foot: $161
- Number of Airbnb Listings: 118
- Monthly Airbnb Rental Income: $2,606
- Airbnb Daily Rate: $162
- Airbnb Occupancy Rate: 55%
- Walk Score: 47
22. Temple Terrace, FL
Airbnb Cash on Cash Return: 4.78%
- Median Property Price: $398,776
- Price per Square Foot: $218
- Number of Airbnb Listings: 131
- Monthly Airbnb Rental Income: $3,202
- Airbnb Daily Rate: $36
- Airbnb Occupancy Rate: 64%
- Walk Score: 63
23. Killeen, TX
Airbnb Cash on Cash Return: 4.60%
- Median Property Price: $268,559
- Price per Square Foot: $146
- Number of Airbnb Listings: 234
- Monthly Airbnb Rental Income: $2,353
- Airbnb Daily Rate: $121
- Airbnb Occupancy Rate: 52%
- Walk Score: 79
24. Maitland, FL
Airbnb Cash on Cash Return: 4.58%
- Median Property Price: $516,188
- Price per Square Foot: $292
- Number of Airbnb Listings: 19
- Monthly Airbnb Rental Income: $3,581
- Airbnb Daily Rate: $154
- Airbnb Occupancy Rate: 64%
- Walk Score: 76
25. Wilton Manors, FL
Airbnb Cash on Cash Return: 4.57%
- Median Property Price: $850,912
- Price per Square Foot: $503
- Number of Airbnb Listings: 334
- Monthly Airbnb Rental Income: $6,293
- Airbnb Daily Rate: $235
- Airbnb Occupancy Rate: 74%
- Walk Score: 76
26. Converse, TX
Airbnb Cash on Cash Return: 4.51%
- Median Property Price: $266,642
- Price per Square Foot: $150
- Number of Airbnb Listings: 123
- Monthly Airbnb Rental Income: $2,577
- Airbnb Daily Rate: $164
- Airbnb Occupancy Rate: 51%
- Walk Score: 46
27. New Port Richey, FL
Airbnb Cash on Cash Return: 4.49%
- Median Property Price: $381,047
- Price per Square Foot: $235
- Number of Airbnb Listings: 103
- Monthly Airbnb Rental Income: $2,892
- Airbnb Daily Rate: $151
- Airbnb Occupancy Rate: 60%
- Walk Score: 68
28. St. Augustine, FL
Airbnb Cash on Cash Return: 4.49%
- Median Property Price: $651,974
- Price per Square Foot: $354
- Number of Airbnb Listings: 2,364
- Monthly Airbnb Rental Income: $4,338
- Airbnb Daily Rate: $209
- Airbnb Occupancy Rate: 61%
- Walk Score: 72
29. Sanford, FL
Airbnb Cash on Cash Return: 4.40%
- Median Property Price: $471,801
- Price per Square Foot: $240
- Number of Airbnb Listings: 210
- Monthly Airbnb Rental Income: $3,331
- Airbnb Daily Rate: $147
- Airbnb Occupancy Rate: 65%
- Walk Score: 69
30. Greenacres, FL
Airbnb Cash on Cash Return: 4.35%
- Median Property Price: $317,491
- Price per Square Foot: $235
- Number of Airbnb Listings: 1,066
- Monthly Airbnb Rental Income: $2,887
- Airbnb Daily Rate: $154
- Airbnb Occupancy Rate: 58%
- Walk Score: 36
The majority of cities on the list are located in the Florida real estate market. Florida remains a hot spot for tourists and by law, no city can outright ban short term rentals. So it could be a good idea to start looking for an Airbnb for sale in Florida today. Just don’t forget to perform your real estate due diligence.
The Verdict
So, is Airbnb profitable?
Yes, an Airbnb property can help you make a lot of money this year if you choose the right market, buy the best property, and set up the optimal pricing strategy. While this sounds like a lot of work, the tools available on the Mashvisor platform can help you with each of these steps, boosting your results with the help of AI and machine learning.
To learn more about how Mashvisor can help you find the most profitable Airbnb investment opportunities across the US market, sign up for a 7-day free trial now, followed by 15% off for life.