Kiamesha Lake Investment Analysis
Investment Property in Kiamesha Lake, NY

Kiamesha Lake, NY Real Estate Investment Performance
$ 1,650,000
Median
13,000
Avg/Sq.ft.
1.00%
Traditional
N/A
Airbnb
$ 4,521
Traditional
N/A
Airbnb
$ 4,521
Traditional
N/A
Airbnb
1
Investment
55
Airbnb
3
Traditional
46%
Airbnb occupancy rate
Kiamesha Lake, NY Properties Rental Prices
| RENTAL STRATEGY | 1 ROOM | 2 ROOMS | 3 ROOMS | 4 ROOMS |
|---|---|---|---|---|
| Airbnb | $ 2,045 | $ 2,204 | $ 3,692 | N/A |
| Traditional | N/A | $ 1,805 | $ 1,995 | $ 2,137 |
| 1 ROOM | $ 2,045 |
|---|---|
| 2 ROOMS | $ 2,204 |
| 3 ROOMS | $ 3,692 |
| 4 ROOMS | N/A |
| 1 ROOM | N/A |
|---|---|
| 2 ROOMS | $ 1,805 |
| 3 ROOMS | $ 1,995 |
| 4 ROOMS | $ 2,137 |
Predict Short-Term Rental Revenue
Want to host your STR property on Airbnb?
Our Airbnb calculator is a free tool to calculate how much can you make on Airbnb.
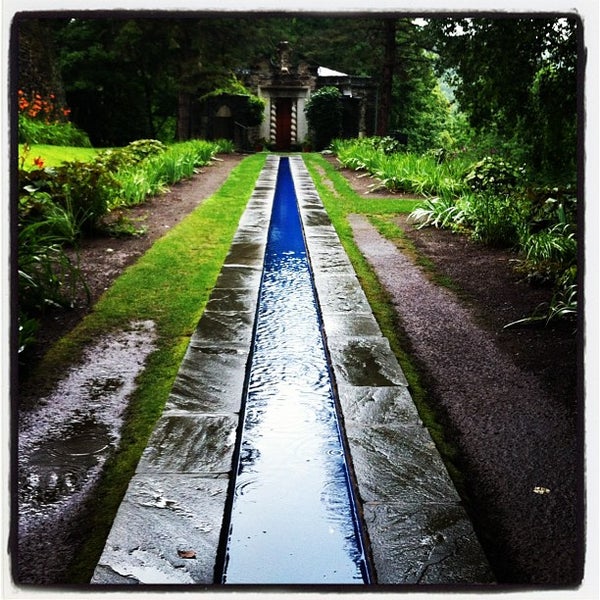
Top Kiamesha Lake, NY Attractions and Activities
-
 Campground
 -
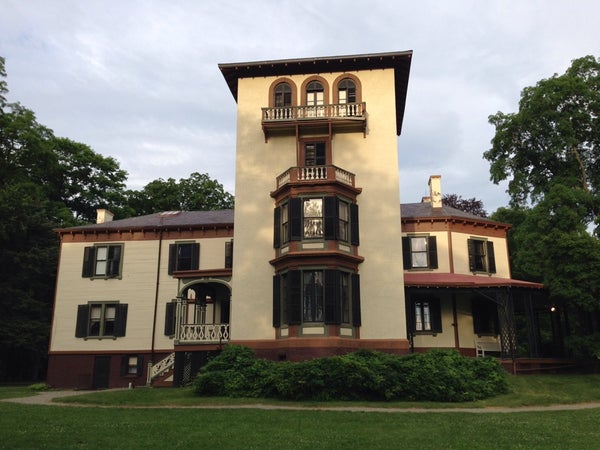
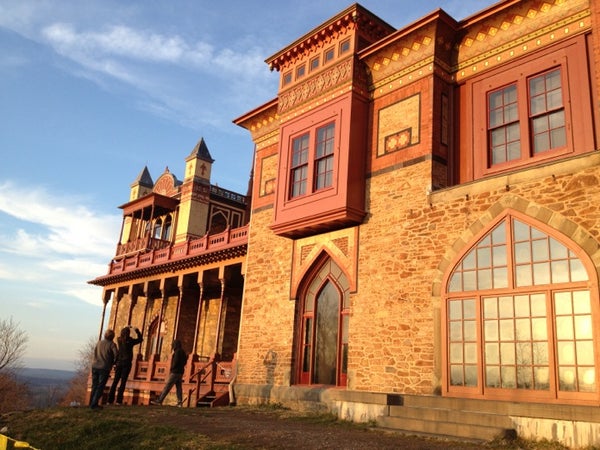
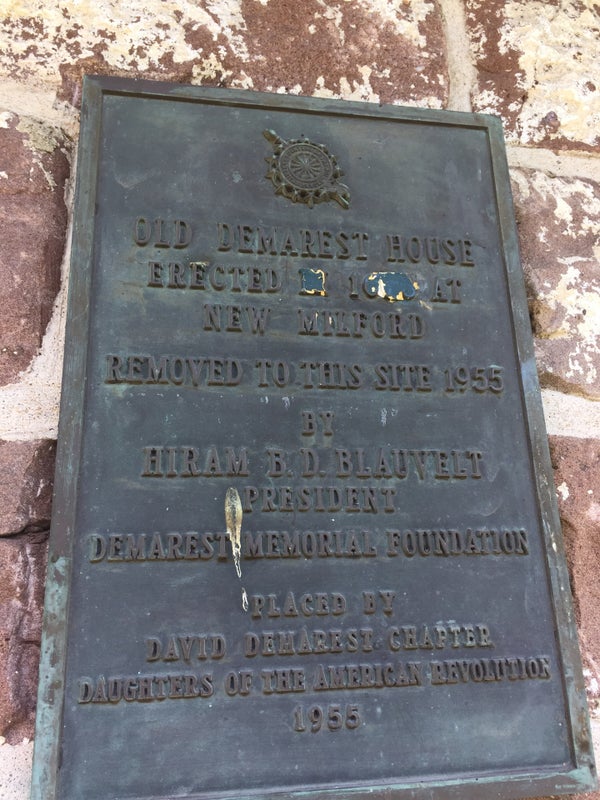
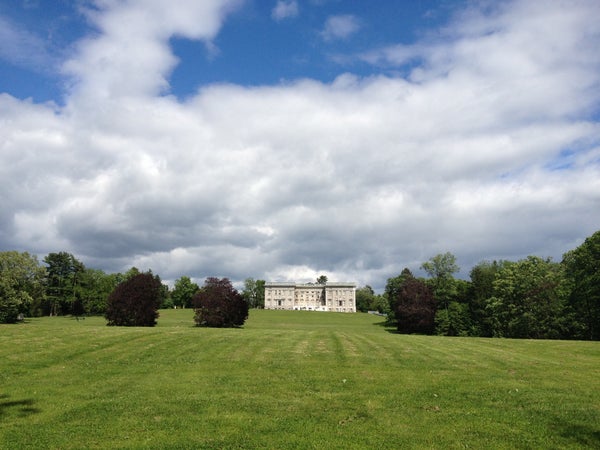
 Historic and Protected Site
 -
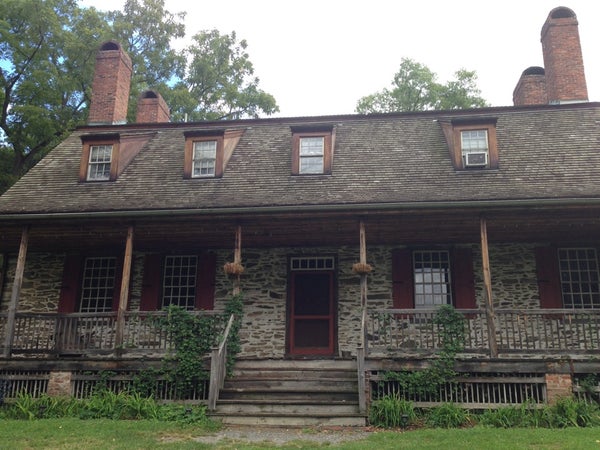
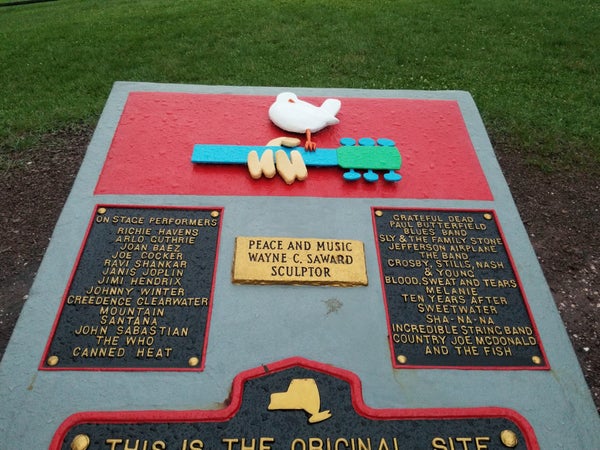 Historic and Protected Site
 -
Historic and Protected Site
-
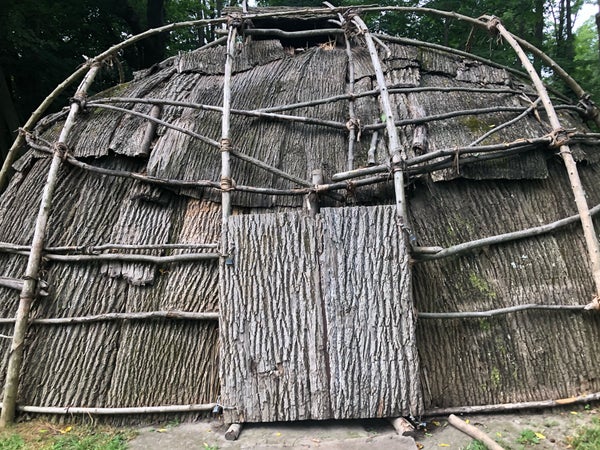
 History Museum
 -
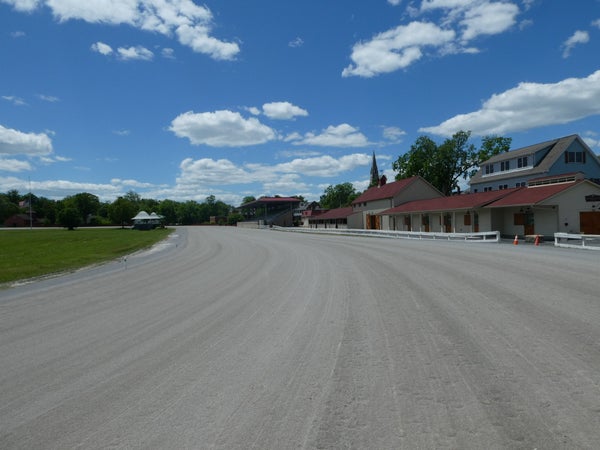 Track
Track -
 Historic and Protected Site
 -
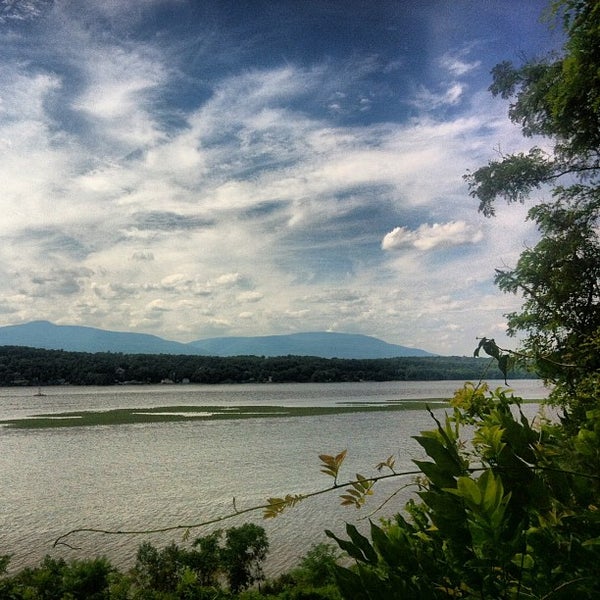
 Scenic Lookout
 -
 Historic and Protected Site
 -
 History Museum
 -
 Historic and Protected Site
 -
 Historic and Protected Site
 -
 Historic and Protected Site
 -
 Scenic Lookout
 -
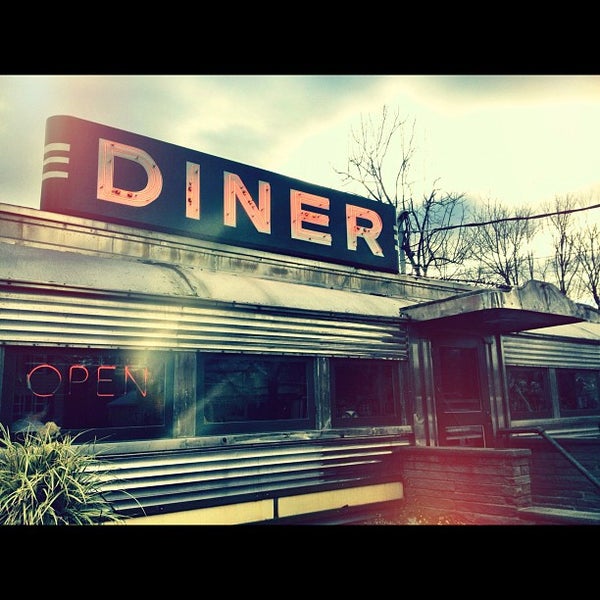 Diner
Diner -
 Hiking Trail
 -
 History Museum
 -
 Historic and Protected Site
 -
 Scenic Lookout
 -
 National Park
 -
 History Museum
 -
 Historic and Protected Site


![%=topPerformingBlogs[i].title%>](https://images.mashvisor.com/40X40/C/https://www.mashvisor.com/blog/wp-content/uploads/2021/12/how-to-calculate-vacancy-rate-585x390.jpg)
![%=topPerformingBlogs[i].title%>](https://images.mashvisor.com/40X40/C/https://www.mashvisor.com/blog/wp-content/uploads/2024/03/Vacation-Rental-Marketing-585x390.jpeg)
![%=topPerformingBlogs[i].title%>](https://images.mashvisor.com/40X40/C/https://www.mashvisor.com/blog/wp-content/uploads/2024/03/Airbnb-Amenities-585x390.jpeg)
![%=topPerformingBlogs[i].title%>](https://images.mashvisor.com/40X40/C/https://www.mashvisor.com/blog/wp-content/uploads/2024/03/Choosing-Vacation-Rental-Software-585x390.jpeg)


