Stottville Investment Analysis
Investment Property in Stottville, NY

Stottville, NY Real Estate Investment Performance
$ 185,000
Median
1,418
Avg/Sq.ft.
21.51%
Traditional
38.89%
Airbnb
$ 2,444
Traditional
$ 4,642
Airbnb
$ 2,444
Traditional
$ 4,642
Airbnb
1
Investment
219
Airbnb
N/A
Traditional
59%
Airbnb occupancy rate
Stottville, NY Properties Rental Prices
| RENTAL STRATEGY | 1 ROOM | 2 ROOMS | 3 ROOMS | 4 ROOMS |
|---|---|---|---|---|
| Airbnb | $ 2,907 | $ 3,365 | $ 5,919 | $ 7,669 |
| Traditional | N/A | $ 2,422 | $ 2,467 | N/A |
| 1 ROOM | $ 2,907 |
|---|---|
| 2 ROOMS | $ 3,365 |
| 3 ROOMS | $ 5,919 |
| 4 ROOMS | $ 7,669 |
| 1 ROOM | N/A |
|---|---|
| 2 ROOMS | $ 2,422 |
| 3 ROOMS | $ 2,467 |
| 4 ROOMS | N/A |
Predict Short-Term Rental Revenue
Want to host your STR property on Airbnb?
Our Airbnb calculator is a free tool to calculate how much can you make on Airbnb.
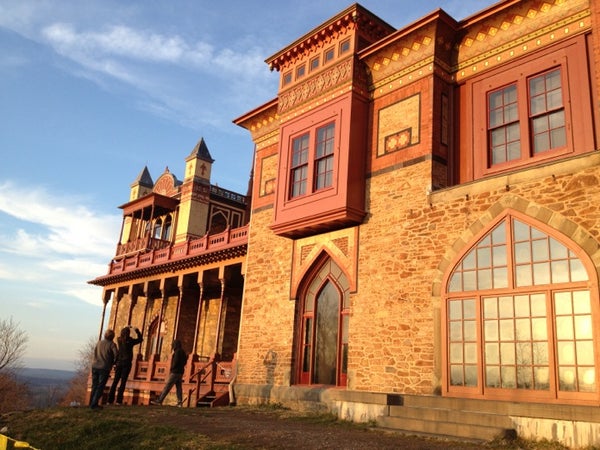
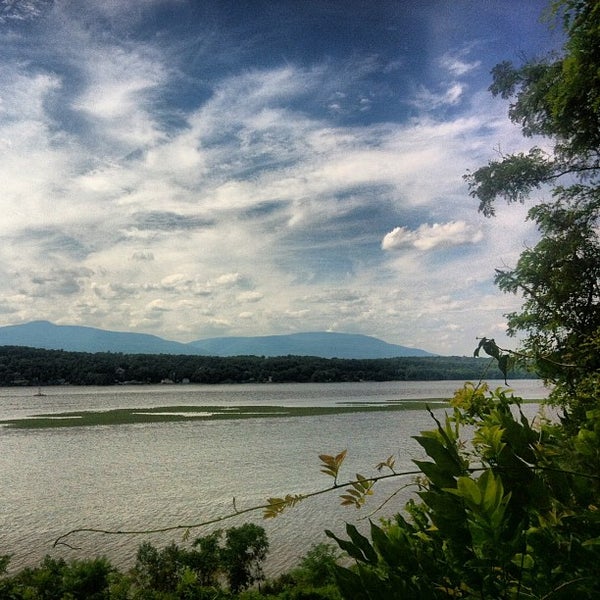
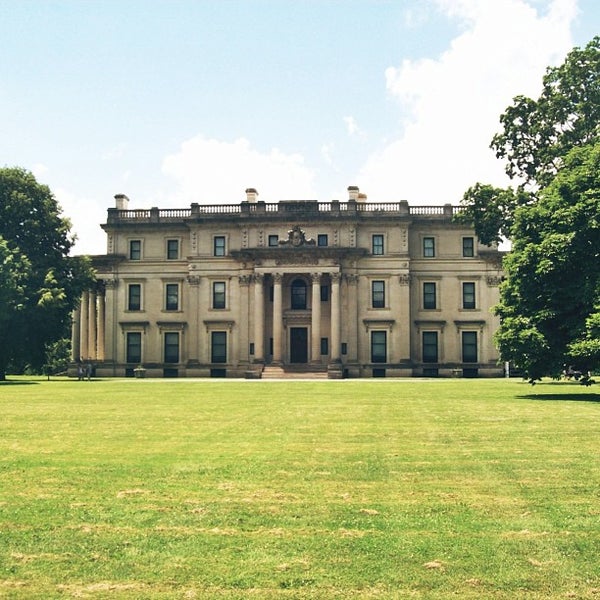
Top Stottville, NY Attractions and Activities
-

Basilica Hudson
9.1
Concert Hall -

Art Omi
9.2
Sculpture Garden -

Helsinki Hudson
8.1
Concert Hall -
 Park
Park -
 Historic and Protected Site
 -

Warren Street
7.7
Art Gallery -
 Opera House
 -
 History Museum
 -
 Movie Theater
 -

Catskill Region
7.2
Mountain -
 Hiking Trail
 -
 Rock Climbing Spot
 -
 Mountain
 -
 Hiking Trail
-
 Nature Preserve
 -
Art Omi
9.2
Sculpture Garden -
Park
-
Historic and Protected Site
-
 Hiking Trail
 -

Love Apple Farm
7.5
Farm -
 Historic and Protected Site
 -

Black Horse Farm
7.8
Farm -
Historic and Protected Site
-
Historic and Protected Site
-
Historic and Protected Site
-
Historic and Protected Site
-
History Museum
-
 Scenic Lookout
 -
 Scenic Lookout
 -
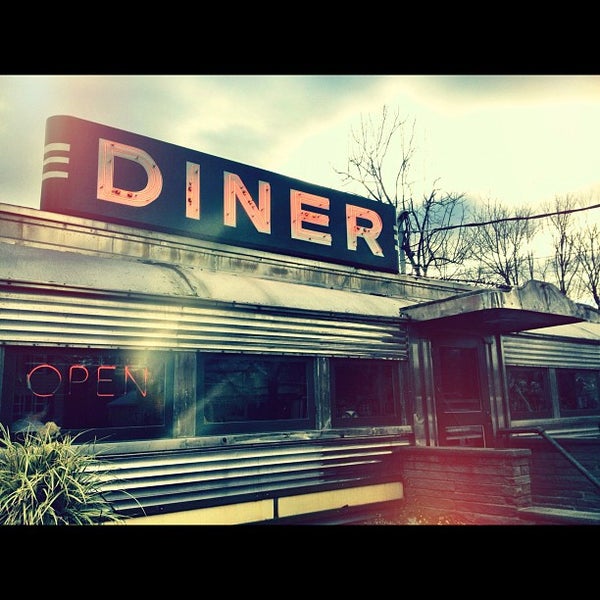 Diner
Diner -
 Historic and Protected Site
 -
 Historic and Protected Site
 -
 Historic and Protected Site
 -
 Scenic Lookout
 -
 Historic and Protected Site
 -
 Historic and Protected Site
 -
 History Museum
 -
 Historic and Protected Site


![%=topPerformingBlogs[i].title%>](https://images.mashvisor.com/40X40/C/https://www.mashvisor.com/blog/wp-content/uploads/2021/12/how-to-calculate-vacancy-rate-585x390.jpg)
![%=topPerformingBlogs[i].title%>](https://images.mashvisor.com/40X40/C/https://www.mashvisor.com/blog/wp-content/uploads/2024/03/Vacation-Rental-Marketing-585x390.jpeg)
![%=topPerformingBlogs[i].title%>](https://images.mashvisor.com/40X40/C/https://www.mashvisor.com/blog/wp-content/uploads/2024/03/Airbnb-Amenities-585x390.jpeg)
![%=topPerformingBlogs[i].title%>](https://images.mashvisor.com/40X40/C/https://www.mashvisor.com/blog/wp-content/uploads/2024/03/Choosing-Vacation-Rental-Software-585x390.jpeg)


