Airbnb data analysis plays a very important role when investing in vacation rental properties in 2023. Investors should not take it for granted.
As a real estate investor looking to buy an Airbnb property, you need to know how to conduct a proper investment property analysis using data analytics and an Airbnb analyzer. These are the things we will discuss in this article.
Table of Contents
- Analyzing Airbnb Data
- Performing Airbnb Data Analysis in 6 Simple Steps
- Top 10 Rental Markets for Airbnb Rentals
Many people considering getting into the short term rental market should never skip conducting Airbnb data analysis when performing their due diligence. Getting a highly accurate analysis of Airbnb data can spell the difference between success and failure in an Airbnb business.
In this article, we will define what Airbnb data analysis is and why it is important. We will also give you some fairly simple, easy-to-follow steps in performing your own Airbnb analysis.
Once you know all of them, you will gain the upper hand over other Airbnb owners and stay competitive in your location. If you currently own a vacation rental property, you can level up your game by reading this article, which will cost you nothing.
At the end, we hope to enlighten you with valuable information that will help you make better investment decisions and be more strategic in managing your Airbnb operations.
Let’s begin.
Related: 40 Best Places for Buying Investment Property in 2023
Analyzing Airbnb Data
Investing in real estate comes in different forms. It all depends on your investment goals and financial situation. It is important to note that each investment will cost you. Not one of them is free. But some, like REITs, cost a lot less than buying an investment property. So, make sure you weigh your options and check your financial capacity before investing.
Some investors have struck gold with house flipping, while others have grown quite comfortable with micro flipping. Others prefer to just go the low-maintenance route and put their money in REITs and real estate crowdfunding. And then there are brave souls who like the thrill of getting into the rental property aspect of real estate investing.
For the last group of people, especially those who want to start their own Airbnb business in 2023, Airbnb data analytics using an analyzer is a non-negotiable thing to do. Before looking for the best investment deals and checking out competitors, you must first do a case study or two and analyze Airbnb data.
Investing in Rental Properties
Investing in rental properties is a good way to generate additional income (as long as you’re in the right location, of course). However, much to the disappointment of many investors, it is not as low-maintenance as one would expect. It requires absolute dedication to know the market inside and out, as well as to stay on top of things throughout the entire rental duration.
Long term rental property owners have it slightly easier, as they only need to check in on their tenants and properties once in a while. The tenants mostly take care of the utilities, and the landlords use the rental payments to pay off the property and other maintenance concerns.
As far as data analysis is concerned, they only need to check in periodically (mostly before a lease expires) to ensure that their rates are still competitive in the market they’re in.
Another rental strategy that’s quite popular right now is vacation rental properties. They are investment properties bought solely to get them listed as short term rentals on online platforms like Airbnb.
The Airbnb platform is basically just a vacation rental marketplace that connects guests and travelers to vacation rental owners or Airbnb hosts for more affordable alternatives to hotels.
The main reason why a lot of real estate investors choose vacation rentals is it offers greater income-generating potential compared to long term rentals. However, just because they generally are more profitable doesn’t mean they’re automatically the right choice for you. Several factors need to be considered before you come to a decision.
Enter Airbnb data analysis.
Why Is Airbnb Data Analysis Important?
As popular and as lucrative as Airbnb investments are, things are a bit more challenging and complicated for Airbnb hosts and owners. On top of the regular maintenance concerns and transitional matters, they also need to be on top of promoting and marketing their property to attract more guests.
Since the success of their businesses lies heavily on occupancy rate, they need to constantly market the property and keep up to date with current neighborhood data and trend changes. Doing so ensures they don’t get left behind and stay in the game.
Thus, Airbnb data analysis is a game-changer for a vacation rental property owner. The process makes you, the investor, aware of the current market conditions and gives you a greater understanding of the location you’re considering or are already in.
The data you gather can then be used for Airbnb data analytics to see if a particular property or neighborhood is worth investing in or if you should just look for another property elsewhere.
It is why highly accurate Airbnb market data can make all the difference for an investor like you. Imagine if your data source is unable to provide enough information for you to make a wise investment decision. That’s a pretty big risk to take.
If you get lucky, you can probably strike gold and do fairly well for the rest of your life. It’s either that or you can end up losing all your hard-earned money on the wrong investment property. And in the game of real estate investing, we never leave anything to chance.
The Right Source and Tools Matter
Your data source is very important to your rental business’ success. The accuracy and realism of your ROI projections will largely depend on the accuracy of your data. While there are a lot of free Airbnb data analytics sites out there, not all of them acquire their data from reliable sources.
Fortunately, the real estate website Mashvisor exists for this very reason. The site houses a very large database of almost every US real estate market. The database is updated regularly to make Airbnb data analysis as accurate as possible.
Mashvisor gets its data from trusted real estate data sources like Zillow, Realtor.com, the MLS, and Airbnb itself. With sources like these, Mashvisor’s users can utilize the platform’s Airbnb analyzer with greater confidence because of the data accuracy the site provides.
The platform provides all the necessary information and real-time market data investors need, such as Airbnb cap rate, Airbnb bookings data, and Airbnb occupancy rate data, among others. It also includes all the similar information for long term rental properties, which levels up your case study a notch.
Accessing both types of data on hand can help investors choose which rental strategy works best for a particular income property.
If you’re an investor looking into starting a rental property business, signing up for a service like Mashvisor will be one of the most strategic things you’ll ever do in 2023.
Related: What Does Airbnb Stand For? The Complete Beginner’s Guide
Performing Airbnb Data Analysis in 6 Simple Steps
For real estate investors seriously considering investing in Airbnb properties, using Mashvisor’s Airbnb analyzer for Airbnb data analysis will help make the process quicker and more efficient.
Here are some easy-to-follow steps when working on data analysis for vacation rentals:
Step 1: Spot the Most Ideal Investment Opportunities With the Property Finder
If you’re searching for a wide range of Airbnb datasets, look no further than Mashvisor’s Property Finder tool. It provides all the short term rental data and information you will need, like Airbnb booking data, to analyze any prospective rental property in any neighborhood accurately.
The Property Finder tool also allows users to look for properties that are well within their financial capacity. It factors in your budget and rental strategy as you sift through the different properties on the site’s massive database.
One of the tool’s most useful features is it lists top results based on cash on cash returns. Additionally, the tool allows users to perform property searches in multiple markets simultaneously.
Step 2: Perform a Neighborhood Evaluation With the Neighborhood Analysis Tool
If you already have a specific location or market in mind, Mashvisor allows you to perform a thorough neighborhood analysis to get a better insight into the market you’re considering.
Some things to consider when performing a neighborhood evaluation are the following:
- There is access to certain tourist attractions and public amenities that draw in plenty of renters and guests;
- Neighborhoods have a high walk score;
- Shopping malls, supermarkets, coffee shops, restaurants, and other public amenities are within reasonable distance;
- Public transportation and safe parking spots are widely available and easily accessible;
- There are very few to no distressed and foreclosed properties on one street; and
- Avoid locations with plenty of closed businesses and underdeveloped areas.
The general rule of thumb to remember is that you, as an investor, should feel comfortable with the neighborhood you’re considering. It should make you feel safe and secure that your property is in a fairly decent and desirable neighborhood.
Related: You Don’t Need Excel Spreadsheets, Just This Short Term Rental Calculator
Step 3: Assess a Property’s Profitability With the Airbnb Property Calculator
Perhaps, the most important aspect of Airbnb data analysis is the actual computation of numbers to determine whether a property is worth investing in or not. It is where Mashvisor’s Airbnb calculator comes in handy.
The tool allows users to calculate critical Airbnb metrics, such as occupancy rate and Airbnb cash flow. It also comes with a free heat map feature that allows users to filter their searches based on the listed properties’ current market performance.
The tool is also highly interactive, as it gives investors the most accurate results whenever different variables are entered into the system. The real-time adjustments are very helpful in determining the actual expected costs and the projected income.
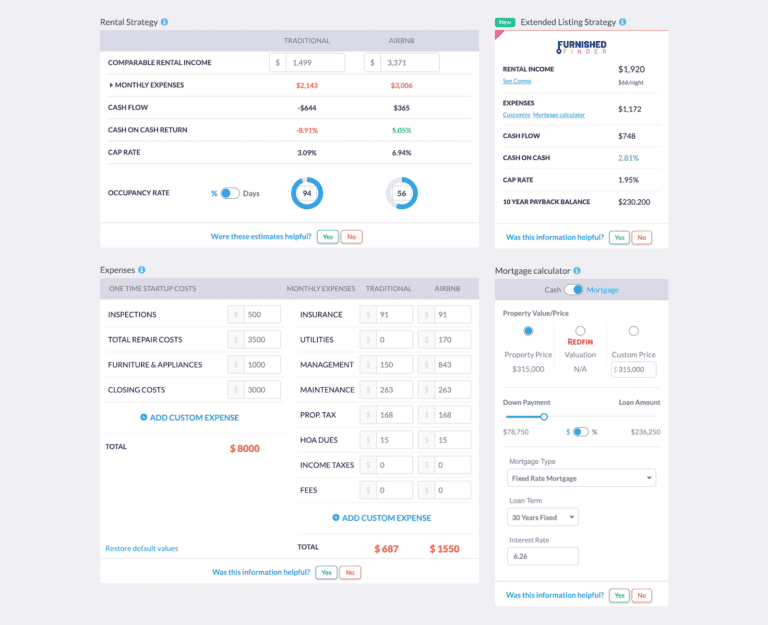
Mashvisor’s Rental Property Calculator lets investors calculate important Airbnb metrics such as cash flow, Airbnb cash flow, cap rate, and occupancy rate.
Step 4: Use the Platform to Access Current Airbnb Rental Comps
The platform also gives users easy access to updated traditional and vacation rental comps in any given market and neighborhood.
The rental comps information is extremely valuable to any rental property investor as it gives them a realistic view of what they can expect in terms of costs, expenses, and income.
Step 5: Estimate and Establish Your Airbnb Rental Rate
Using the rental comps, you can easily see what the going rates are for your property to be competitive in the local market. Once you’ve studied the different similar rental properties, you can come up with a fair enough price that will allow you to get in the game and not be left behind by your competitors.
It is important to note that, generally, rental rates are computed according to square footage. Calculate the cost of comparables on a per-square-foot basis to get a pretty good idea of potential Airbnb nightly rates. Make sure to also factor in all the costs and expenses related to the acquisition and maintenance of the property to determine its viability.
Step 6: Make Sure to Always Double-Check the Numbers Before Making a Final Decision
Lastly, whenever possible, always double-check your data and computations. A slight miscalculation can lead to catastrophic results. Missing a single digit or misplacing a decimal point will lead to a very large difference between the actual results and your computations. So, make double-checking data, formulas, and computations a habit.
To start looking for and analyzing the best investment properties in your city and neighborhood of choice, click here.
Top 10 Rental Markets for Airbnb Rentals
Now that you already know how to use Mashvisor for your Airbnb data analysis, let’s take a look at the top Airbnb rental markets according to the website’s February 2023 data.
Related: How to Use Airbnb Predictive Analytics to Earn a High ROI
Two of the main identifiers used to prepare the list below are the number of Airbnb listings on the market and the cash on cash return rate. Although there are numerous other markets that offer higher cash on cash returns, we only included the top markets with above 100 Airbnb listings. It is because they provide more sample properties for accurate Airbnb comps.
Based on Mashvisor’s report, we‘ve listed ten markets best suited for Airbnb investments in 2023. We used the following criteria to filter the thousands of real estate markets found on the site:
- Each location must have a median property price of $1,000,000 and below.
- Each location must have at least 100 active listings on the short term rental market to indicate that there is a demand for Airbnb properties in the area.
- Each location must offer at least a monthly short term rental income of $2,000 to consider it a profitable market
- Each location must have a minimum of 2% cash on cash return. While experts agree that the best cash on cash returns are between 8% and 12%, a 2% return is a good starting point.
- Each location must have no less than a 50% Airbnb occupancy rate.
The following list has been ranked according to short term rental cash on cash return, from the highest all the way to the lowest.
1. Northlake, IL
- Median Property Price: $315,829
- Average Price per Square Foot: $216
- Days on Market: 107
- Number of Airbnb Listings: 116
- Monthly Airbnb Rental Income: $4,151
- Airbnb Cash on Cash Return: 7.94%
- Airbnb Cap Rate: 8.08%
- Airbnb Daily Rate: $169
- Airbnb Occupancy Rate: 54%
- Walk Score: 33
Search for Northlake, IL investment properties for sale.
2. Bellwood, IL
- Median Property Price: $250,612
- Average Price per Square Foot: $218
- Days on Market: 87
- Number of Airbnb Listings: 173
- Monthly Airbnb Rental Income: $3,809
- Airbnb Cash on Cash Return: 7.92%
- Airbnb Cap Rate: 8.07%
- Airbnb Daily Rate: $164
- Airbnb Occupancy Rate: 62%
- Walk Score: 83
Search for Bellwood, IL investment properties for sale.
3. Columbia Heights, MN
- Median Property Price: $297,238
- Average Price per Square Foot: $151
- Days on Market: 47
- Number of Airbnb Listings: 317
- Monthly Airbnb Rental Income: $3,761
- Airbnb Cash on Cash Return: 7.92%
- Airbnb Cap Rate: 8.06%
- Airbnb Daily Rate: $160
- Airbnb Occupancy Rate: 58%
- Walk Score: 82
Search for Columbia Heights, MN investment properties for sale.
4. Bridgeton, MO
- Median Property Price: $272,978
- Average Price per Square Foot: $151
- Days on Market: 46
- Number of Airbnb Listings: 120
- Monthly Airbnb Rental Income: $3,330
- Airbnb Cash on Cash Return: 7.60%
- Airbnb Cap Rate: 7.74%
- Airbnb Daily Rate: $154
- Airbnb Occupancy Rate: 58%
- Walk Score: 3
Search for Bridgeton, MO investment properties for sale.
5. Rileyville, VA
- Median Property Price: $332,031
- Average Price per Square Foot: $192
- Days on Market: 15
- Number of Airbnb Listings: 153
- Monthly Airbnb Rental Income: $3,733
- Airbnb Cash on Cash Return: 7.57%
- Airbnb Cap Rate: 7.69%
- Airbnb Daily Rate: $235
- Airbnb Occupancy Rate: 55%
- Walk Score: 10
Search for Rileyville, VA investment properties for sale.
6. Harpers Ferry, WV
- Median Property Price: $373,269
- Average Price per Square Foot: $261
- Days on Market: 113
- Number of Airbnb Listings: 132
- Monthly Airbnb Rental Income: $3,872
- Airbnb Cash on Cash Return: 7.22%
- Airbnb Cap Rate: 7.32%
- Airbnb Daily Rate: $196
- Airbnb Occupancy Rate: 53%
- Walk Score: 0
Search for Harpers Ferry, WV investment properties for sale.
7. Maywood, IL
- Median Property Price: $219,313
- Average Price per Square Foot: $156
- Days on Market: 96
- Number of Airbnb Listings: 327
- Monthly Airbnb Rental Income: $3,066
- Airbnb Cash on Cash Return: 7.19%
- Airbnb Cap Rate: 7.38%
- Airbnb Daily Rate: $160
- Airbnb Occupancy Rate: 59%
- Walk Score: 58
Search for Maywood, IL investment properties for sale.
8. Bar Harbor, ME
- Median Property Price: $590,000
- Average Price per Square Foot: $402
- Days on Market: 58
- Number of Airbnb Listings: 297
- Monthly Airbnb Rental Income: $5,896
- Airbnb Cash on Cash Return: 7.13%
- Airbnb Cap Rate: 7.19%
- Airbnb Daily Rate: $316
- Airbnb Occupancy Rate: 64%
- Walk Score: 77
Search for Bar Harbor, ME investment properties for sale.
9. Robbinsdale, MN
- Median Property Price: $333,943
- Average Price per Square Foot: $136
- Days on Market: 54
- Number of Airbnb Listings: 351
- Monthly Airbnb Rental Income: $3,802
- Airbnb Cash on Cash Return: 7.08%
- Airbnb Cap Rate: 7.19%
- Airbnb Daily Rate: $164
- Airbnb Occupancy Rate: 57%
- Walk Score: 73
Search for Robbinsdale, MN investment properties for sale.
10. Columbia, MO
- Median Property Price: $311,780
- Average Price per Square Foot: $146
- Days on Market: 85
- Number of Airbnb Listings: 253
- Monthly Airbnb Rental Income: $3,090
- Airbnb Cash on Cash Return: 7.01%
- Airbnb Cap Rate: 7.14%
- Airbnb Daily Rate: $136
- Airbnb Occupancy Rate: 58%
- Walk Score: 30
Search for Columbia, MO investment properties for sale.
As you can clearly see from the statistics above, all markets come with a cash on cash return of at least 7%, with high occupancy rates. It shows you that when you’re in the right market, investing in Airbnb properties can be a very lucrative venture.
Get started on your 7-day free trial with Mashvisor today to get access to its Airbnb analyzer and other tools to get you on your way to a thriving real estate investing career.
Wrapping Up
You should never take the Airbnb data analysis process for granted for it can do you plenty of good, especially when you do it right.
Being able to access the right tools and up-to-date data will make Airbnb data analysis highly accurate and give you, the investor, greater confidence in the decision-making process. Investors who are serious about starting a rental property business should take the matter seriously. It can make or break your business venture.
Whether you’re new to real estate investing or have been in the game for quite some time now, Mashvisor can help you in your real estate investing journey. Signing up for a subscription will give you access to high-quality data. Such reliable information will let you come up with a highly accurate and realistic ROI projection.
The platform will also give you access to the right tools so you can crunch the numbers with greater confidence, leaving no room for error.