When analyzing real estate investments, investors typically rely on a free rental income and expense worksheet to identify a great opportunity.
For this reason, knowing how to create a template for your monthly rental income and expenses spreadsheet will save you time and effort from doing it over and over. You can use this free rental income and expense worksheet template whenever you see potential investment opportunities.
Table of Contents
- Why Invest in Rental Property
- What Is a Rental Property Excel Spreadsheet?
- What If I Don’t Want to Use an Excel Spreadsheet?
A rental property Excel worksheet is a tool that is often used by rental property owners to analyze several real estate properties and compare them based on numerous types of data. A good alternative would be to use an online worksheet like Google Sheets.
This tool calculates the totals of your gross income and net income by deducting your rental property expenses from the former. You can use it for both long term and short term rental property investments.
Regardless of the rental strategy you want to use, investing in real estate is all about making the right decisions based on data and research. So, if you’re looking to make a successful real estate investment, you should know all about rental property spreadsheets and how to use them.
We will show you exactly how to do that in this article. We will also show you a better and more efficient alternative to free worksheet templates.
Why Invest in Rental Property
Real estate investing is a great way to expand your portfolio and build a hedge fund in case the economy goes sideways.
While there are many investment strategies to choose from in real estate, rental properties are perhaps the most popular type of real estate investment. Owning a profitable rental property is synonymous with having a passive income source. It provides you with security and financial stability. Rental property investing, therefore, is a great way to build wealth and equity.
More importantly, investing in a well-managed rental property allows you to finance the property with a mortgage as you make enough rental income to cover the mortgage payments. When you carefully and thoughtfully manage your property’s finances, its generated rental income should be more than enough to cover its mortgage payments for years to come.
After a while, you will end up with a property you fully own—one that generates far more income than it’s costing you. That is one thing that determines when you’ve made a successful investment.
But how do you know when you’ve found an ideal rental property to invest in?
It’s All About the Rental Income
When it comes to finding an excellent investment property, rental property investing is all about rental income generation. However, simply finding an investment property with the highest rental income is not enough. Your property’s potential rental income depends on factors like its price, size, and type, among other things.
Additionally, the rental income of properties can vary significantly across different markets. For that reason, you need a better way of measuring the value of a property based on its rental income.
This is where metrics such as the cap rate or the cash on cash return become very relevant.
Rental Property Return on Investment
The two most commonly used metrics for measuring a rental property’s return on investment are the capitalization rate and the cash on cash return.
These two metrics give you similar information about the projected value of rental property investment. The difference, however, depends on how you want to measure it and the type of financing you want to use.
The cap rate metric calculates the rate of return that an investment property will generate from its rental income compared to its market value. In other words, you use it to see how long it takes for the rental property to generate enough rental income to cover its price.
The cap rate formula is as follows:
Cap Rate = (Net Operating Income / Property’s Price) x 100
The cash on cash return, on the other hand, measures the rate of return based on the amount of out-of-pocket money you’re investing in the property. So, instead of using the property’s fair market value, you will only use the total down payment and closing costs you will need to pay in cash while you finance the rest of the purchase with a mortgage.
Simply put, it is a dollar-for-dollar computation on an investment property.
The cash on cash return formula is as follows:
Cash on Cash Return = (Net Operating Income / Cash Invested) x 100
Both metrics discussed are essential for comparing rental properties and determining their investment value. Consequently, they are crucial when creating a rental property Excel worksheet or a rent ledger template.
What Is a Rental Property Excel Spreadsheet?
We’ve already talked about the appeal of investing in rental properties and why making decisions based on thorough analysis and comparison is crucial. Now let’s talk about using an Excel worksheet for rental property.
A rental property Excel spreadsheet is a tool that lets you compare several rental properties in a market to determine the ones with the best value. You do this by categorizing properties based on different types of data and sorting properties based on their return on investment. Using an Excel spreadsheet also applies to rental property management.
The types of data and information you want to include in an Excel rental property spreadsheet template depend on your particular case and investment strategy.
So, how exactly do you use an Excel spreadsheet for a rental property?
How to Use a Rental Property Spreadsheet
The first step to using a rental property Excel spreadsheet is gathering the data you will use in your template. Generally, the information you need should include anything related to the property and your investment. Some of these are:
- Original purchase price of the property: This is the price at which you bought the property, regardless of how that value changes over time.
- Current market value of the property: This is the price at which you can sell the property based on current market conditions.
- Mortgage: This includes mortgage payments, interest rates, and down payment.
- Taxes and insurance: This includes all costs related to taxes and insurance for each property, depending on the market’s location.
- Income and expenses: This pertains to any additional sources of income attached to the property and related expenses that it may incur, such as property management and HOA fees.
- Other crucial info: This may include anything notable about the property or the market that may determine appreciation or present potential for revenue.
- Current occupancy status: This is all about whether the property is owner-occupied or under lease and its lease agreement details if they’re available.
- Tenant information: If tenants currently occupy the property, the info can help you get in touch with your potential future tenants.
By gathering all the above info and including it in your Excel spreadsheet for rental property management, you can then compare all the different properties based on whatever metric you choose.
The information about your prospective investment property can tell you a lot about its potential as a rental income generator. However, it is best if you combine it with some math to come up with fail-proof conclusions.
Example of a Rental Property Excel Spreadsheet
As mentioned above, the type of info you should include in your Excel rental property spreadsheet template depends on your investment goals. We also talked about important metrics to use when comparing rental properties to determine their potential return on investment.
Let’s go over an example of a rental property Excel spreadsheet using a cap rate and cash on cash return. Keep in mind that the example given does not include all the details that an investor would typically use in their rent ledger template.
To keep it simple, we will only discuss the fields needed to include the cap rate and cash on cash return.
Example No. 1: Cap Rate
To analyze rental properties and compare them based on their cap rate, you first need to create an Excel sheet and populate it with all the info you need to get the NOI.
The NOI, which stands for net operating income, of each property is one of the two primary values needed to calculate its cap rate. It means that you need to know the following for each property you’re comparing:
- Its potential rental income and any other sources of passive income attached to the property (i.e., rental parking).
- All costs and expenses related to buying and owning the property.
After including the said values in the columns of your free spreadsheet, you can enter all recurring expenses and subtract them from your monthly income to get your NOI.
Next, you will want to create a new spreadsheet including the same properties where you can calculate their cap rate. Since you already have the NOI and the property price for each item on the list, you can use the cap rate formula from above to populate this field.
Example No. 2: Cash on Cash Return
Calculating the cash on cash return is slightly more complicated as you will need to include the mortgage in your spreadsheet. Generally, however, it follows the same logic.
This time, you will include the mortgage payments and interest rate when calculating your NOI. You will only have the down payment and closing costs instead of the property’s price.
The complication may come when you compare properties in different markets, as you might need to calculate different types of mortgages at different interest rates. It will depend on how high (or low) mortgage rates are in a particular market.
Other Types of Rental Property Spreadsheets
When searching online, you will come across several types of free rental property spreadsheets. Some of them might seem too convoluted with information. This can be overwhelming for beginner investors. Others might be too limited or not focus on the type of data you’re looking for.
Yes, it is easy to find a free rental property Excel spreadsheet online. However, most investors will recommend creating your own. You will find other types of free spreadsheet templates and use several of them, each for different use.
Let’s take a spreadsheet template for Excel property management, for example. It is an excellent tool for managing rental properties that you own. However, when it comes to finding a great investment property to purchase, it may not be suitable for you.
What if I Don’t Want to Use an Excel Spreadsheet?
For decades, rental property spreadsheets were the main tools used to compare and analyze rental properties. But what if you don’t want to use one and go through all the hassles?
Nowadays, finding alternative tools for a rental property Excel spreadsheet template is much easier. These online tools gather data, run the analytics, and give you the same type of output that a traditional spreadsheet would.
Depending on your use, such tools can tell you what a property’s potential ROI is over the next ten years with a single click of a button. It’s easy to assume that most investors nowadays prefer this option over using traditional or free Excel spreadsheets.
And if this is something that you’re interested in, then you’re lucky because we have the right online platform for you.
Mashvisor’s Real Estate Platform vs Rental Property Excel Spreadsheet
Mashvisor is a platform designed for real estate investing. It helps investors overcome the hassle of using free but limited spreadsheets. It utilizes a sophisticated AI that gathers data from trusted sources such as the MLS and Airbnb. With this, Mashvisor can:
- Help investors find lucrative rental properties based on their projected returns;
- Provide the tools and data necessary for analyzing the current and future value of each property;
- Compare different rental strategies (traditional vs Airbnb rentals);
- Analyze entire markets for their average performance;
- Calculate your rental income, cap rate, cash on cash return, mortgage payments, and more.
For any data and information that would typically require you to use a spreadsheet to calculate and analyze, Mashvisor can do it in the blink of an eye.
Instead of gathering data on multiple properties and manually entering them into your spreadsheet templates, use Mashvisor’s tools. You can jump straight to the conclusions that will help you make smart investment decisions.
Finding a Profitable Market to Invest in
One of Mashvisor’s newest tools is the Market Finder. It gives you an overview of a real estate market and details of its different neighborhoods. The tool makes it easier to compare several markets and see how they stack against each other in terms of profitability.
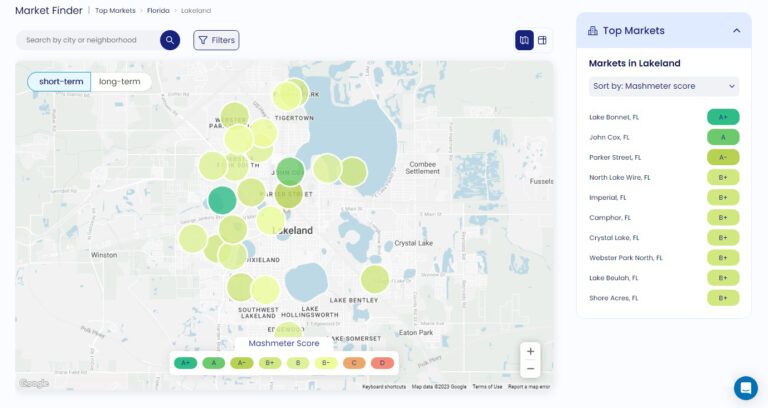
Using Mashvisor’s Market Finder lets you do things a free rental income and expense worksheet can’t, like giving you an overview of how different markets are performing in a particular location.
You can customize your search using different filters to see how each neighborhood performs. The filters include:
- Home Value
- Property Type
- Monthly Rental Revenue
- Cap Rate
- Occupancy Rate
- School Rankings
- Crime and Safety
Using this tool cuts your search in minutes compared to the conventional way. It allows you to focus your attention on other equally important matters. As a rental property investor, it makes more sense to use Mashvisor instead of a free worksheet.
Get access to Mashvisor’s Market Finder and other tools to get you on your way to a thriving real estate investing career. Get started on your 7-day free trial today.
High-Quality Data for Your Analyzing Needs
One of the things that make Mashvisor stand out among all other real estate apps and websites is its database. One, it has an extensive database that covers nearly every real estate housing market in the US.
Two, it is known for highly reliable data. It collects data from highly reliable sources such as Realtor.com, RedFin, the MLS, and Airbnb.
Three, it regularly updates its database so you only have the latest information at your fingertips. All three make Mashvisor’s real estate data highly reliable and relevant. This type of high-quality data is why investors prefer to use Mashvisor.
When you use Mashvisor as your source for quality real estate data, you are assured of highly accurate and realistic ROI projections and revenue calculations.
Market and Investment Property Analysis Made Easy
Mashvisor’s rental property analytics include each property’s rental income and all of its related costs and expenses based on current market data.
When visiting any property’s page on the platform, you will find an investment property calculator that functions similarly to a rental property Excel spreadsheet. The calculator, which also works as an Airbnb calculator, will include fields for all of the costs and expenses, the rental income of the property, its cash on cash return, and the cap rate.
Costs and expenses are pre-filled based on the market’s averages and rental comps. These include:
- Rental property taxes
- Insurance
- HOA fees
- Property management
- Renovation costs
- Cleaning fees
- Utilities (water and electricity)
- Property maintenance
You can change the values as you see fit or add additional values to both the recurring and one-time related to the property. Additionally, the tool also comes with a mortgage calculator.
The mortgage calculator includes different types of mortgages, and you can change the interest rate, duration, and down payment based on your particular case. Making changes or adding input to the expenses or mortgage calculator will immediately be reflected in the rest of the calculations, such as the cap rate and cash on cash return.
These features will make computing ROI and revenue much more accurate and realistic. Investors who use Mashvisor’s calculator have greater confidence in making investment decisions.
Finding the Right Investment Property for You
Finally, when it comes to finding rental properties, Mashvisor does it best. Instead of relying on a rental property Excel spreadsheet to find the perfect property to invest in, you can use the platform to find one in minutes.
By utilizing all of the data mentioned above, Mashvisor’s Property Finder tool allows you to set your search parameters to match the exact characteristics of your dream investment property. Simply enter the US market that you want to invest in using the map search tool and use the filters to narrow down your search based on the following:
- Your budget
- Type of property (single-family, multifamily, condo/co-op, townhouse)
- Rental income
- Number of bedrooms/bathrooms
- Property status
- Projected cap rate
- Projected cash on cash return
- Rental strategy (short-term or long-term rental)
The map will show you all rental properties listed for sale that match your search criteria.
But that’s not all!
The tool will show you what each property’s stats are in terms of rental income, cap rate, and cash on cash return, and it will tell you whether the property is performing above or below the market’s averages.
Additionally, you will see a list of all the properties, which you can sort based on your metric of choice.
Final Thoughts
Using a free rental income and expense worksheet is the traditional way of finding and analyzing several rental properties to identify the best investment option.
It is no surprise that the tool has always been incredibly crucial for real estate investors who aspire to be successful. However, using a worksheet to compare properties manually can be a major hassle that turns many people away from investing in real estate.
In today’s modern world, it is now easy to find better alternatives and tools that are more efficient compared to an Excel worksheet.
Mashvisor is perhaps the best option compared to using spreadsheets. One, the platform provides you with all the important information that you need to make a lucrative and informed investment decision. Two, it has the right tools to help you analyze real estate data. Three, you get more bang for your buck compared to similar real estate platforms.
Make sure to subscribe to Mashvisor and gain access to all of our tools and features that will help you gain an edge in today’s hyper-competitive real estate market.