Even with today’s conditions due to the coronavirus pandemic, real estate investing is still one of the best ways to become wealthy and is still considered a safe haven. Mortgage interest rates are low, home prices are stable, and rental prices are growing. However, how profitable a real estate investment has and will always depend on location. If the market dynamics are optimal, then you’ll have an opportunity to make a good return on investment. So the important question to ask is: where are the best places to invest in real estate?
Finding the top markets requires running an in-depth real estate market analysis which could take a lot of your time. Mashvisor, however, makes this a lot easier and more efficient. Every year, we put out a list of the best cities in the US for real estate investing to give investors an idea of where they should buy rental properties. We’ve already released a list of the best places to invest in real estate at the beginning of the year. But, as the second half of the year just around the corner and market conditions changed, we believe an update is necessary.
In this article, we review the best places to buy rental property according to Mashvisor’s data. To make sure you’re selecting a real estate market based on your investment strategy, we’ve organized the cities into 5 categories. You’ll see where to invest in rental property for affordability, traditional rental income, Airbnb rental income, and traditional cash on cash return, and Airbnb cash on cash return. Mashvisor’s real estate data is taken from reliable listing sources like the MLS and Zillow. Learn more about our data methodology.
Related: How to Choose a Real Estate Market to Invest In
Best Places to Invest in Real Estate – Affordability
The first category and factor that investors base their decision on when it comes to where they’ll find the best real estate investments is property prices. As you’re setting up a plan for real estate investing, the first thing you determine is your budget. It’s important to have a budget because it helps you narrow down your options of cities according to median prices. It’ll also help later when you start searching for rental properties for sale as it allows you to focus on properties that you can actually afford. Here’s a list of the most affordable housing markets in the US right now! These are the best cities for affordable real estate investments where median prices are way below the national median.
1) Waterbury, CT Median Property Price: $152,300
- Price per Square Foot: $97
- Traditional Rental Income: $1,333
- Airbnb Rental Income: $1,219
- Price to Rent Ratio: 10
- Airbnb Occupancy Rate: 39%
- Average Days on Market: 88
2) Hutchinson, KS Median Property Price: $164,916
- Price per Square Foot: $80
- Traditional Rental Income: $1,031
- Airbnb Rental Income: $1,570
- Price to Rent Ratio: 13
- Airbnb Occupancy Rate: 49%
- Average Days on Market: 106
3) Midwest City, OK Median Property Price: $180,943
- Price per Square Foot: $106
- Traditional Rental Income: $1,114
- Airbnb Rental Income: $1,796
- Price to Rent Ratio: 14
- Airbnb Occupancy Rate: 60%
- Average Days on Market: NA
4) North Little Rock, AR Median Property Price: $185,804
- Price per Square Foot: $98
- Traditional Rental Income: $921
- Airbnb Rental Income: $1,636
- Price to Rent Ratio: 17
- Airbnb Occupancy Rate: 57%
- Average Days on Market: 71
5) Riverton, WY Median Property Price: $188,731
- Price per Square Foot: $105
- Traditional Rental Income: $1,058
- Airbnb Rental Income: $1,048
- Price to Rent Ratio: 15
- Airbnb Occupancy Rate: 36%
- Average Days on Market: 118
6) Warsaw, MO Median Property Price: $189,335
- Price per Square Foot: $109
- Traditional Rental Income: $1,017
- Airbnb Rental Income: $1,200
- Price to Rent Ratio: 16
- Airbnb Occupancy Rate: 38%
- Average Days on Market: 111
7) Springfield, IL Median Property Price: $189,760
- Price per Square Foot: $100
- Traditional Rental Income: $1,104
- Airbnb Rental Income: $1,905
- Price to Rent Ratio: 14
- Airbnb Occupancy Rate: 54%
- Average Days on Market: 76
8) Fairmont, WV Median Property Price: $192,742
- Price per Square Foot: $117
- Traditional Rental Income: $1,005
- Airbnb Rental Income: $2,241
- Price to Rent Ratio: 16
- Airbnb Occupancy Rate: 66%
- Average Days on Market: 26
9) Des Moines, IA Median Property Price: $193,567
- Price per Square Foot: $151
- Traditional Rental Income: $973
- Airbnb Rental Income: $2,332
- Price to Rent Ratio: 17
- Airbnb Occupancy Rate: 75%
- Average Days on Market: 86
10) Huntington, WV Median Property Price: $198,393
- Price per Square Foot: $85
- Traditional Rental Income: $1,068
- Airbnb Rental Income: $1,808
- Price to Rent Ratio: 15
- Airbnb Occupancy Rate: 54%
- Average Days on Market: 160
To find an affordable investment property for sale in your market of choice, click here!
Best Cities to Invest in Real Estate – Traditional Rental Income
One of the most important metrics to determine the profitability of investment properties is the potential rental income. This is true for both traditional long-term rentals and Airbnb short-term rentals. If you want to become a landlord, then these the best places to invest in real estate in the US for high rental income. Keep in mind, however, that high rental income cities typically have a steep median price which can make it hard to find an affordable investment property for sale. So, make sure to run an analysis to see whether owning rental property allows you to make positive cash flow before buying one.
Related: How to Find Positive Cash Flow Properties
1) Westport, CT Traditional Rental Income: $5,714
- Median Property Price: $1,104,744
- Price per Square Foot: $414
- Price to Rent Ratio: 16
- Average Days on Market: 133
2) Wilton, CT Traditional Rental Income: $4,378
- Median Property Price: $735,877
- Price per Square Foot: $262
- Price to Rent Ratio: 14
- Average Days on Market: 146
3) Portsmouth, RI Traditional Rental Income: $4,169
- Median Property Price: $804,103
- Price per Square Foot: $361
- Price to Rent Ratio: 16
- Average Days on Market: 98
4) Key West, FL Traditional Rental Income: $3,808
- Median Property Price: $996,594
- Price per Square Foot: $692
- Price to Rent Ratio: 22
- Average Days on Market: 125
5) Rehoboth Beach, DE Traditional Rental Income: $3,581
- Median Property Price: $730,573
- Price per Square Foot: $351
- Price to Rent Ratio: 17
- Average Days on Market: 174
6) Norwalk, CT Traditional Rental Income: $3,455
- Median Property Price: $728,917
- Price per Square Foot: $316
- Price to Rent Ratio: 18
- Average Days on Market: 100
7) Jupiter, FL Traditional Rental Income: $3,207
- Median Property Price: $772,510
- Price per Square Foot: $340
- Price to Rent Ratio: 20
- Average Days on Market: 104
8) Stamford, CT Traditional Rental Income: $3,190
- Median Property Price: $589,787
- Price per Square Foot: $267
- Price to Rent Ratio: 15
- Average Days on Market: 67
9) Boston, MA Traditional Rental Income: $3,150
- Median Property Price: $1,016,629
- Price per Square Foot: $721
- Price to Rent Ratio: 27
- Average Days on Market: 60
10) Jackson, WY Traditional Rental Income: $3,010
- Median Property Price: $1,727,383
- Price per Square Foot: $773
- Price to Rent Ratio: 47
- Average Days on Market: 177
Best Cities to Invest in Real Estate – Airbnb Rental Income
As mentioned, rental income is a great way to determine the profitability of an Airbnb investment property as well. Most of the time, investors prefer renting out their properties on Airbnb because it usually yields higher rental income. But, that’s not true in all locations. Here are the best places to invest in real estate by listing your property as a short-term rental. If you don’t already own a property in these cities and you’re planning to buy one specifically to list it as a vacation rental, make sure to check the city’s short-term rental regulations first. Regulations often include paying high taxes which could affect your Airbnb income.
1) Key West, FL Airbnb Rental Income: $8,822
- Median Property Price: $996,594
- Price per Square Foot: $692
- Airbnb Occupancy Rate: 57%
- Average Airbnb Daily Rate: $694
2) Greenwich, CT Airbnb Rental Income: $5,291
- Median Property Price: $1,729,364
- Price per Square Foot: $579
- Airbnb Occupancy Rate: 52%
- Average Airbnb Daily Rate: $255
3) Sedona, AZ Airbnb Rental Income: $4,960
- Median Property Price: $922,910
- Price per Square Foot: $343
- Airbnb Occupancy Rate: 76%
- Average Airbnb Daily Rate: $161
4) Benton, AR Airbnb Rental Income: $4,836
- Median Property Price: $283,989
- Price per Square Foot: $125
- Airbnb Occupancy Rate: 58%
- Average Airbnb Daily Rate: $139
5) Parkville, MO Airbnb Rental Income: $4,484
- Median Property Price: $476,840
- Price per Square Foot: $151
- Airbnb Occupancy Rate: 58%
- Average Airbnb Daily Rate: $104
6) Isle of Palms, SC Airbnb Rental Income: $4,433
- Median Property Price: $879,730
- Price per Square Foot: $488
- Airbnb Occupancy Rate: 42%
- Average Airbnb Daily Rate: $450
7) Annapolis, MD Airbnb Rental Income: $4,388
- Median Property Price: $702,137
- Price per Square Foot: $293
- Airbnb Occupancy Rate: 51%
- Average Airbnb Daily Rate: $284
8) Broken Bow, OK Airbnb Rental Income: $4,371
- Median Property Price: $486,782
- Price per Square Foot: $258
- Airbnb Occupancy Rate: 59%
- Average Airbnb Daily Rate: $249
9) Bridgeport, CT Airbnb Rental Income: $4,327
- Median Property Price: $255,297
- Price per Square Foot: $156
- Airbnb Occupancy Rate: 48%
- Average Airbnb Daily Rate: $155
10) Portsmouth, NH Airbnb Rental Income: $4,312
- Median Property Price: $755,057
- Price per Square Foot: $395
- Airbnb Occupancy Rate: 58%
- Average Airbnb Daily Rate: $268
Best Places to Invest in Real Estate – Traditional Cash on Cash Return
Cash on cash return is the best metric for calculating the rate of return on a rental property because it’s more accurate than the cap rate or the simple ROI formula. Cash on cash return lets you factor in your financing method (cash or mortgage) to estimate your returns based on how much money you actually invested. Like the cap rate, COC return varies by city and even neighborhood. Below you’ll find a list of the best places to buy investment property for high cash on cash return. Keep in mind these are just city averages. You can use Mashvisor’s Real Estate Heatmap to analyze each housing market and find rental properties for sale with higher returns.

Mashvisor’s Real Estate Heatmap
Related: Finding Income Properties Using a Heatmap
1) Heartland, TX Traditional Cash on Cash Return: 6%
- Median Property Price: $233,929
- Price per Square Foot: $118
- Traditional Rental Income: $2,515
- Price to Rent Ratio: 8
- Average Days on Market: NA
2) Redford, MI Traditional Cash on Cash Return: 5%
- Median Property Price: $123,233
- Price per Square Foot: $105
- Traditional Rental Income: $1,350
- Price to Rent Ratio: 8
- Average Days on Market: 79
3) Valparaiso, IN Traditional Cash on Cash Return: 5%
- Median Property Price: $353,406
- Price per Square Foot: $145
- Traditional Rental Income: $2,522
- Price to Rent Ratio: 12
- Average Days on Market: 98
4) Union Township, OH Traditional Cash on Cash Return: 5%
- Median Property Price: $229,668
- Price per Square Foot: $121
- Traditional Rental Income: $1,942
- Price to Rent Ratio: 10
- Average Days on Market: 59
5) Sun City West, AZ Traditional Cash on Cash Return: 4%
- Median Property Price: $330,329
- Price per Square Foot: $168
- Traditional Rental Income: $2,373
- Price to Rent Ratio: 12
- Average Days on Market: 43
6) Westfield, IN Traditional Cash on Cash Return: 4%
- Median Property Price: $367,844
- Price per Square Foot: $130
- Traditional Rental Income: $2,676
- Price to Rent Ratio: 11
- Average Days on Market: 80
7) Florence, SC Traditional Cash on Cash Return: 4%
- Median Property Price: $239,762
- Price per Square Foot: $104
- Traditional Rental Income: $1,590
- Price to Rent Ratio: 13
- Average Days on Market: 135
8) Ozark, MO Traditional Cash on Cash Return: 4%
- Median Property Price: $308,981
- Price per Square Foot: $128
- Traditional Rental Income: $2,021
- Price to Rent Ratio: 13
- Average Days on Market: 52
9) Park Forest, IL Traditional Cash on Cash Return: 4%
- Median Property Price: $132,926
- Price per Square Foot: $107
- Traditional Rental Income: $1,313
- Price to Rent Ratio: 8
- Average Days on Market: 67
10) Clarksburg, WV Traditional Cash on Cash Return: 4%
- Median Property Price: $142,856
- Price per Square Foot: $76
- Traditional Rental Income: $1,015
- Price to Rent Ratio: 12
- Average Days on Market: 25
Best Cities to Invest in Real Estate – Airbnb Cash on Cash Return
If you’re looking for the best places to invest in real estate for Airbnb, then you should have Airbnb data for cash on cash return as well. Luckily, Mashvisor’s real estate API provides this type of data and more. Our nationwide short-term rental data comes directly from Airbnb.com and mirrors the performance of actual Airbnb listing over the past 12 months. Investors can, thus, assure that our Airbnb data is accurate and reliable for making investment decisions. According to this data, you can find the best Airbnb investments with high cash on cash returns in the following real estate markets.
1) Lake Zurich, IL Airbnb Cash on Cash Return: 8.8%
- Median Property Price: $338,434
- Price per Square Foot: $167
- Airbnb Rental Income: $4,179
- Airbnb Occupancy Rate: 58%
- Average Airbnb Daily Rate: $125
2) Calera, AL Airbnb Cash on Cash Return: 7.2%
- Median Property Price: $237,447
- Price per Square Foot: $150
- Airbnb Rental Income: $2,442
- Airbnb Occupancy Rate: 48%
- Average Airbnb Daily Rate: $104
3) Benton, AR Airbnb Cash on Cash Return: 7.2%
- Median Property Price: $283,989
- Price per Square Foot: $125
- Airbnb Rental Income: $4,836
- Airbnb Occupancy Rate: 58%
- Average Airbnb Daily Rate: $139
4) Ladson, SC Airbnb Cash on Cash Return: 6.8%
- Median Property Price: $243,625
- Price per Square Foot: $134
- Airbnb Rental Income: $2,725
- Airbnb Occupancy Rate: 63%
- Average Airbnb Daily Rate: $117
5) Florissant, MO Airbnb Cash on Cash Return: 6.7%
- Median Property Price: $167,721
- Price per Square Foot: $89
- Airbnb Rental Income: $2,368
- Airbnb Occupancy Rate: 68%
- Average Airbnb Daily Rate: $89
6) Belleville, IL Airbnb Cash on Cash Return: 6.7%
- Median Property Price: $172,890
- Price per Square Foot: $89
- Airbnb Rental Income: $2,618
- Airbnb Occupancy Rate: 65%
- Average Airbnb Daily Rate: $117
7) Cuyahoga Falls, OH Airbnb Cash on Cash Return: 6.7%
- Median Property Price: $193,177
- Price per Square Foot: $119
- Airbnb Rental Income: $2,660
- Airbnb Occupancy Rate: 41%
- Average Airbnb Daily Rate: $79
8) Pike Road, AL Airbnb Cash on Cash Return: 6.3%
- Median Property Price: $378,356
- Price per Square Foot: $156
- Airbnb Rental Income: $4,115
- Airbnb Occupancy Rate: 49%
- Average Airbnb Daily Rate: $199
9) Greenville, NC Airbnb Cash on Cash Return: 6.3%
- Median Property Price: $241,088
- Price per Square Foot: $110
- Airbnb Rental Income: $2,370
- Airbnb Occupancy Rate: 67%
- Average Airbnb Daily Rate: $100
10) New Castle, DE Airbnb Cash on Cash Return: 6.1%
- Median Property Price: $232,875
- Price per Square Foot: $135
- Airbnb Rental Income: $3,149
- Airbnb Occupancy Rate: 59%
- Average Airbnb Daily Rate: $136
To start looking for and analyzing investment properties in the best places to invest in real estate, click here.
Final Words for Real Estate Investors
After reading these lists of best places to invest in real estate, you probably have an idea of which cities best match your investment strategy. But your market research is not done yet. The next steps are to find the best neighborhood in your city of choice and, then, find an investment property for sale. You can easily complete these tasks using Mashvisor’s tools! We’ve mentioned the Real Estate Heatmap that provides neighborhood data so you can analyze and identify which area is best for investing in real estate based on property prices, rental income, and cash on cash return (for both traditional and Airbnb rentals).
Mashvisor’s real estate investment software also comes with a Property Finder, the ultimate tool for finding rental properties. Using this tool, you can find properties for sale in up to 5 cities at the same time. Meaning, your property search can be done in a matter of minutes. And that’s not all – you can also find off-market properties on our Property Marketplace! Moreover, all real estate data above are estimated using Mashvisor’s Investment Property Calculator which you can also get access to. This tool provides a pre-estimated analysis for every property in the US housing market that tells you how profitable the property is as a traditional and an Airbnb investment.
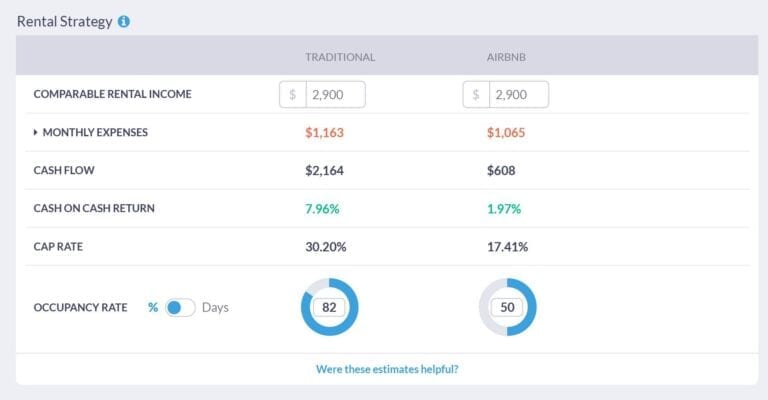
Mashvisor’s Investment Property Calculator
Want to access and use these great tools to find the best investments in your market of choice? All you’ve got to do is sign up for Mashvisor. Start Your 7-Day Free Trial Now!